Background processing usage, Dialog response time – H3C Technologies H3C Intelligent Management Center User Manual
Page 636
622
•
Attribute/Value—Monitor index name and data.
{
Spool Process Usage—Percentage of the operating spool processes to the total number of spool
processes when APM last polled SAP.
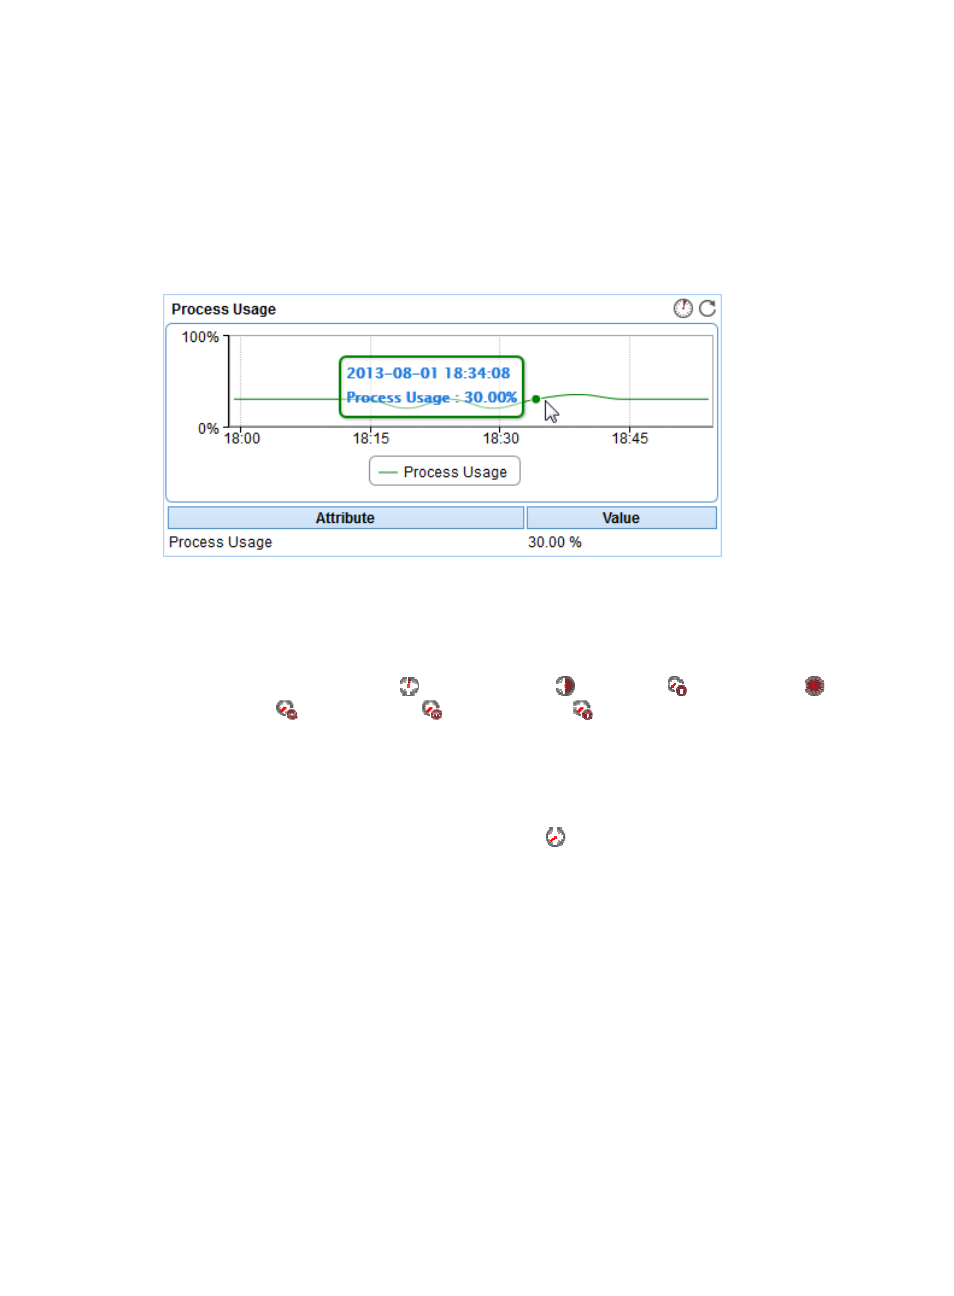
Background Processing Usage
The Background Processing Usage area appears on both Overview and Background tabs. Its layout is
shown in
.
Figure 523 Background Processing Usage area layout
Background Processing Usage area fields:
•
Trend graph—Shows the changes of the background processing usage for the SAP application in
a line chart. Point to a spot on the curve to view the background processing usage at the specific
time point. View the changes of the background processing usage over a specific time period by
clicking the Last 1 Hour icon
, Last 6 Hours icon
, Today icon
, Yesterday icon
, This
Week icon
, This Month icon
, or This Year icon
. The graph shows the last hour data by
default.
•
Attribute/Value—Monitor index name and data.
{
Background Processing Usage—Percentage of the active background processes to the total
background processes when APM last polled SAP.
{
History Record—Click the History Record icon
to view the history trend graph of the
background processing usage. Point to a spot on the curve to view data at the specific time point.
Authorized users can view statistics over the last 1 hour, last 6 hours, today, yesterday, this week,
this month, and this year by clicking the corresponding icons on the graph.
Dialog Response Time
The Dialog Response Time area appears on both Overview and Dialog tabs. Its layout is shown in
.