H3C Technologies H3C Intelligent Management Center User Manual
Page 637
623
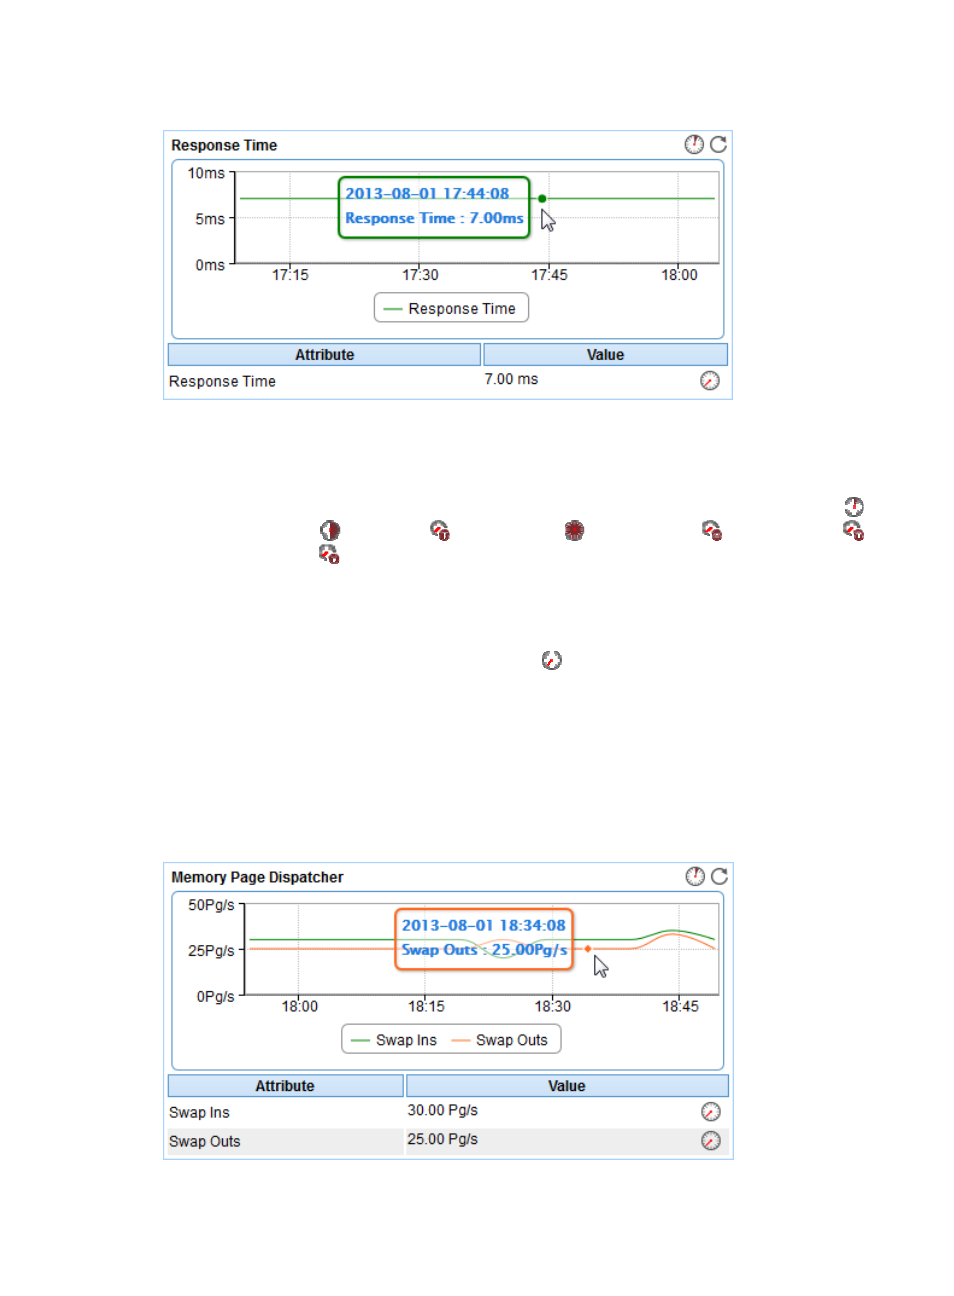
Figure 524 Dialog Response Time area layout
Dialog Response Time area fields:
•
Trend graph—Shows the changes of the dialog response time for the SAP application in a line chart.
Point to a spot on the curve to view the dialog response time at the specific time point. View the
changes of the dialog response time over a specific time period by clicking the Last 1 Hour icon
,
Last 6 Hours icon
, Today icon
, Yesterday icon
, This Week icon
, This Month icon
,
or This Year icon
. The graph shows the last hour data by default.
•
Attribute/Value—Monitor index name and data.
{
Dialog Response Time—Response time of the dialog service for the SAP application when it
was last polled by APM.
{
History Record—Click the History Record icon
to view the history trend graph of the dialog
response time. Point to a spot on the curve to view data at the specific time point. Authorized
users can view statistics over the last 1 hour, last 6 hours, today, yesterday, this week, this month,
and this year by clicking the corresponding icons on the graph.
Memory Page Dispatcher
The Memory Page Dispatcher area appears on both Overview and OS tabs. Its layout is shown in
.
Figure 525 Memory Page Dispatcher area layout