Transactions, N in, Figure 318 – H3C Technologies H3C Intelligent Management Center User Manual
Page 392
378
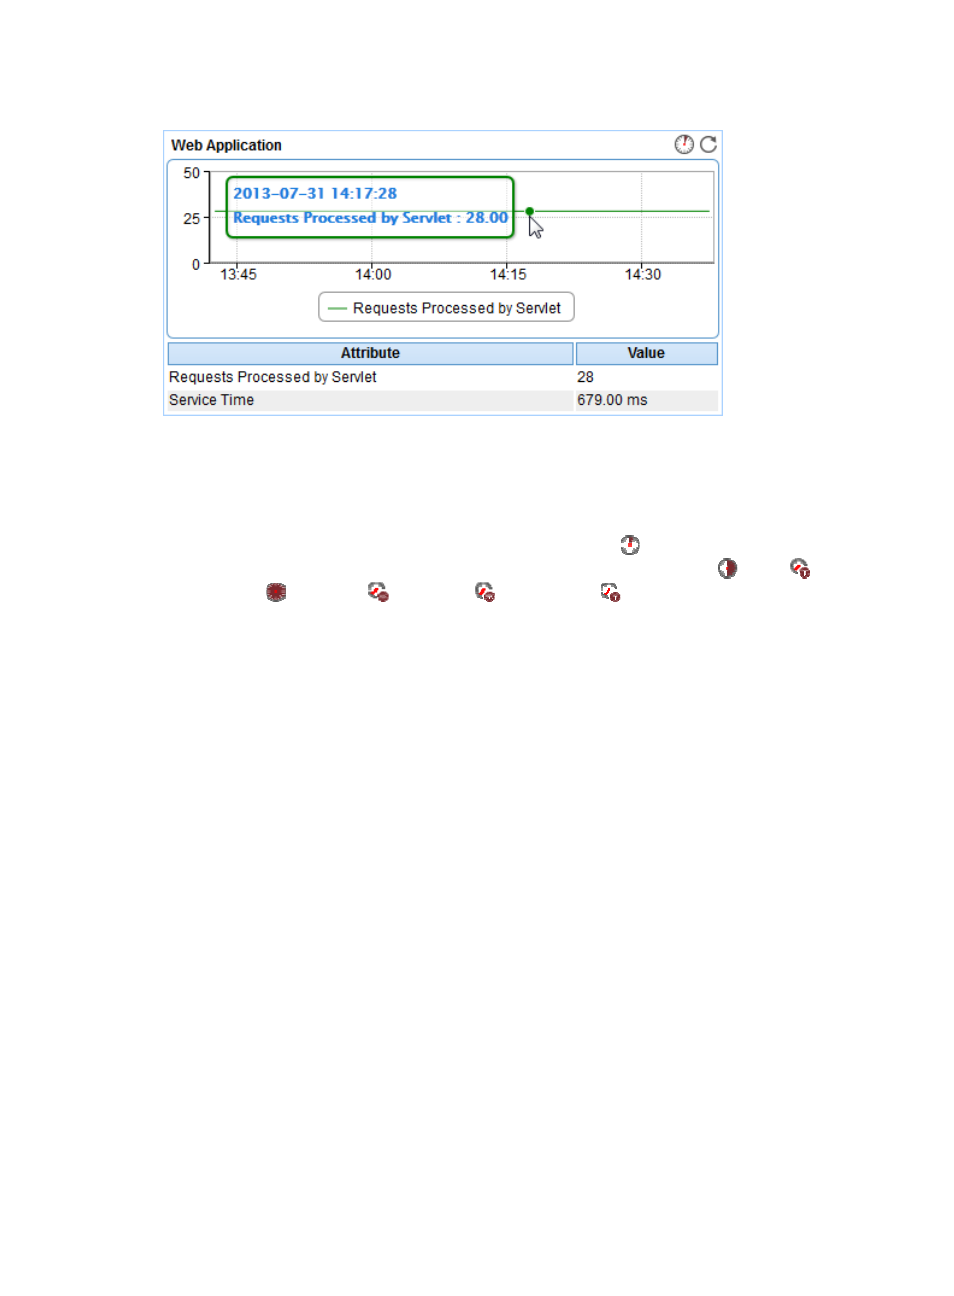
Figure 318 Web Application area layout
Web Application area fields:
•
Requests processed by servlet trend graph—Shows changes of the number of requests processed
by the Servlet over the selected time period in a line graph. Point to a spot in the curve to view the
number of processed requests at the specific time point. By default, the graph shows the last 1 hour
data. To change the report period, click the Last 1 Hour icon
on the upper right of the graph,
and then select an icon from the list. Available options include Last 6 Hours
, Today
,
Yesterday
, This Week
, This Month
, and This Year
.
•
Attribute/Value—Monitor index name and data.
{
Requests Processed by Servlet—Total number of requests processed by the Servlet since the
WebSphere server started until the last polling interval.
{
Service Time—Average time taken by the Servlet to process and respond to the requests in the
last polling interval.
Transactions
The Transactions area layout is shown in