Application traffic, Figure 276 – H3C Technologies H3C Intelligent Management Center User Manual
Page 346
332
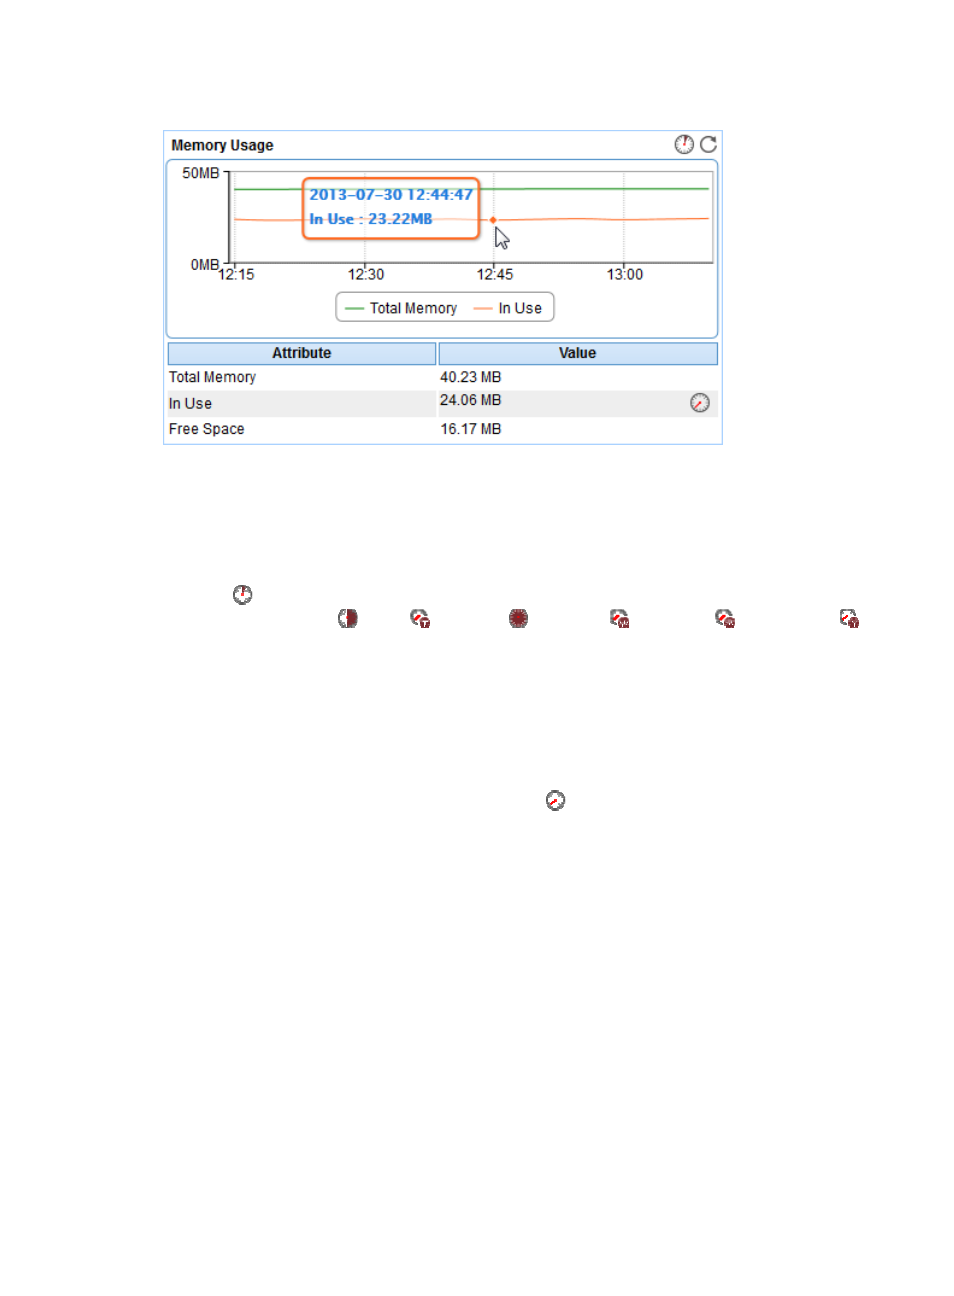
Figure 276 Memory Usage area layout
Memory Usage area fields:
•
Memory usage trend graph—Shows the memory usage trend of the Tomcat server over the selected
time period in a line graph. The green curve shows the total memory and the orange curve shows
the used memory. Point to a spot in the curve to view the memory usage at the specific time point.
By default, the graph shows the last 1 hour data. To change the report period, click the Last 1 Hour
icon
on the upper right of the graph, and then select an icon from the list. Available options
include Last 6 Hours
, Today
, Yesterday
, This Week
, This Month
, and This Year
.
Click Total Memory or In Use to display or hide the corresponding monitor index in the graph.
•
Attribute/Value—Monitor index name and data.
{
Total Memory—Total memory allocated to the Tomcat server by the operating system in the last
polling interval.
{
In Use—Used memory of the Tomcat server in the last polling interval.
{
Free Space—Free memory of the Tomcat server in the last polling interval.
{
History Record—Click the History Record icon
to view the history graph of the memory
usage trend of the Tomcat server. Point to a spot on the curve to view the memory usage statistics
at the specific time point. Authorized users can view memory usage statistics over the last 1 hour,
last 6 hours, today, yesterday, this week, this month, and this year by clicking the corresponding
icons on the upper right of the graph.
Application Traffic
The Application Traffic area layout is shown in
. APM collects the traffic statistics of the Tomcat
server based on the IP address and port number of the Tomcat server host.