H3C Technologies H3C Intelligent Management Center User Manual
Page 597
583
Active Server Pages
The Active Server Pages area layout is shown in
.
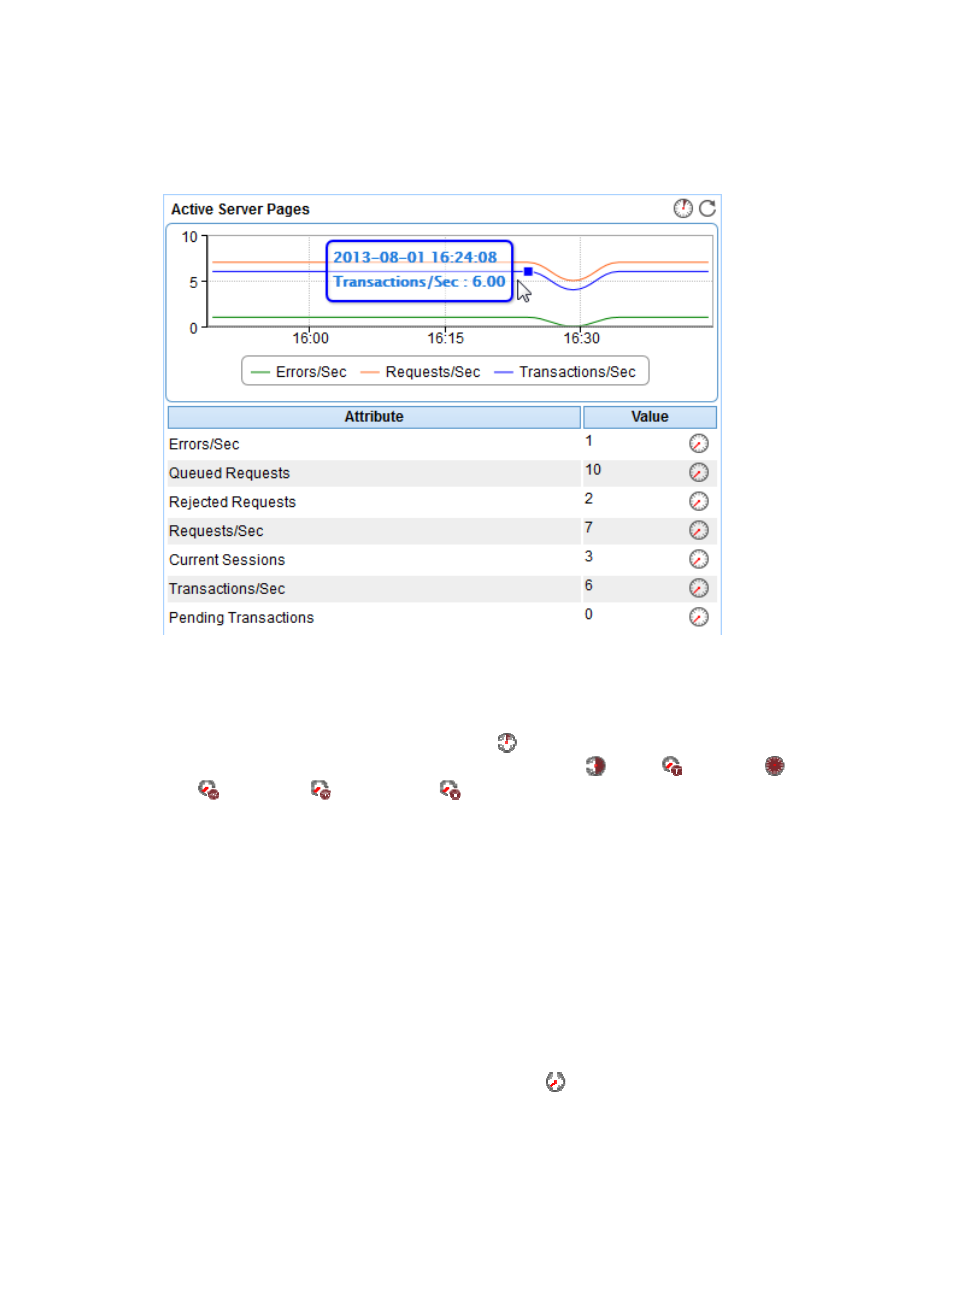
Figure 488 Active Server Pages area layout
Active Server Pages area fields:
•
Active Server Pages trend graph—Shows changes of Active Server Pages (ASP) statistics over the
last 1 hour. Point to a spot on the curve to view the monitor data at the specific time point. To change
the report period, click the Last 1 Hour icon
on the upper right of the graph, and then select an
icon from the list. Available options include Last 6 Hours
, Today
, Yesterday
, This Week
, This Month
, and This Year
. Click the legend names to display or hide the
corresponding monitor indexes in the graph.
•
Attribute/Value—Monitor index name and data that was obtained when APM last polled Office
SharePoint 2010.
{
Errors/Sec—Average number of errors per second.
{
Queued Requests—Number of requests waiting for services in the queue.
{
Rejected Requests—Number of requests rejected due to insufficient resources.
{
Requests/Sec—Average number of requests executed per second.
{
Current Sessions—Number of sessions being served per second.
{
Transactions/Sec—Average number of transactions started per second.
{
Pending Transactions—Number of transactions being processed.
{
History Record—Click the History Record icon
to view the history trend graph of the
corresponding index. Point to a spot on the curve to view the monitor data at the specific time
point. Authorized users can view statistics over the last 1 hour, last 6 hours, today, yesterday, this
week, this month, and this year by clicking the corresponding icons on the upper right of the
graph.