Analysis – Basler Electric DECS-400 User Manual
Page 123
9369700990 Rev R
111
Setup. Trend log acquisition is enabled and disabled through this setting.
Trend Duration. Trend log duration is configured by three time settings: Day(s), Hour(s), and Minutes(s).
The Day(s) setting has a range of 0 to 31 days with 1 day increments. The Hour(s) setting has a range of
0 to 23 hours with 1 hour increments. The Minute(s) setting has a range of 0 to 58 minutes with 1 minute
increments. A read-only field below the Trend Duration settings displays the trend duration selected.
Download Trend Log. This button is clicked to display the Trending File Download screen, which enables
you to save a trending file with a “log” file extension. Trend log duration and parameters are selected on
the Trending tab of the Data Log screen.
Analysis
Click the Analysis button on the tool bar to view the Analysis screen.
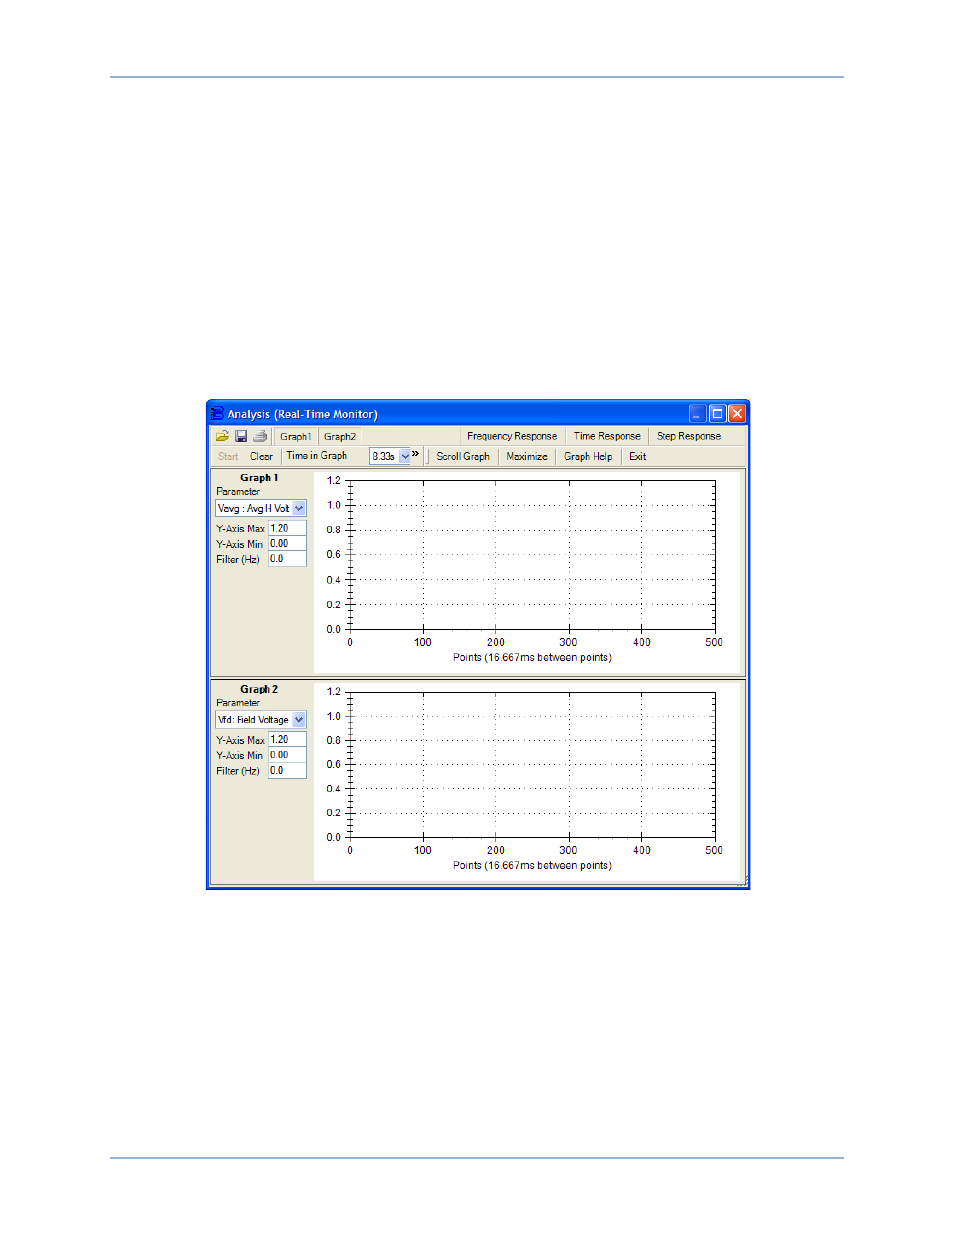
The Analysis screen can be used to perform and monitor on-line PSS and AVR testing. Two plots of user-
selected data can be generated and the logged data can be stored in a file for later examination. Analysis
screen controls and indications are shown in Figure 78 and described in the following paragraphs.
Figure 78. Analysis Screen
Save Button. Graphs can be saved in a file by clicking this button.
Open Button. DECS-400 graphs saved with a .dg4 file extension can be retrieved with this button.
Print Button. Clicking this button displays a print preview screen that enables printing of graphs.
Graph 1. When this button is depressed, graph 1 is displayed on the Analysis screen. When this button is
raised, only graph 2 is displayed.
Graph 2. When this button is depressed, graph 2 is displayed on the Analysis screen. When this button is
raised, only graph 1 is displayed.
Start/Stop. This button starts and stops the acquisition of data points for the graphs. The button is labeled
Start when graphing is stopped and Stop when graphing is active.
DECS-400
BESTCOMS™ Software