Basler Electric DECS-400 User Manual
Page 125
9369700990 Rev R
113
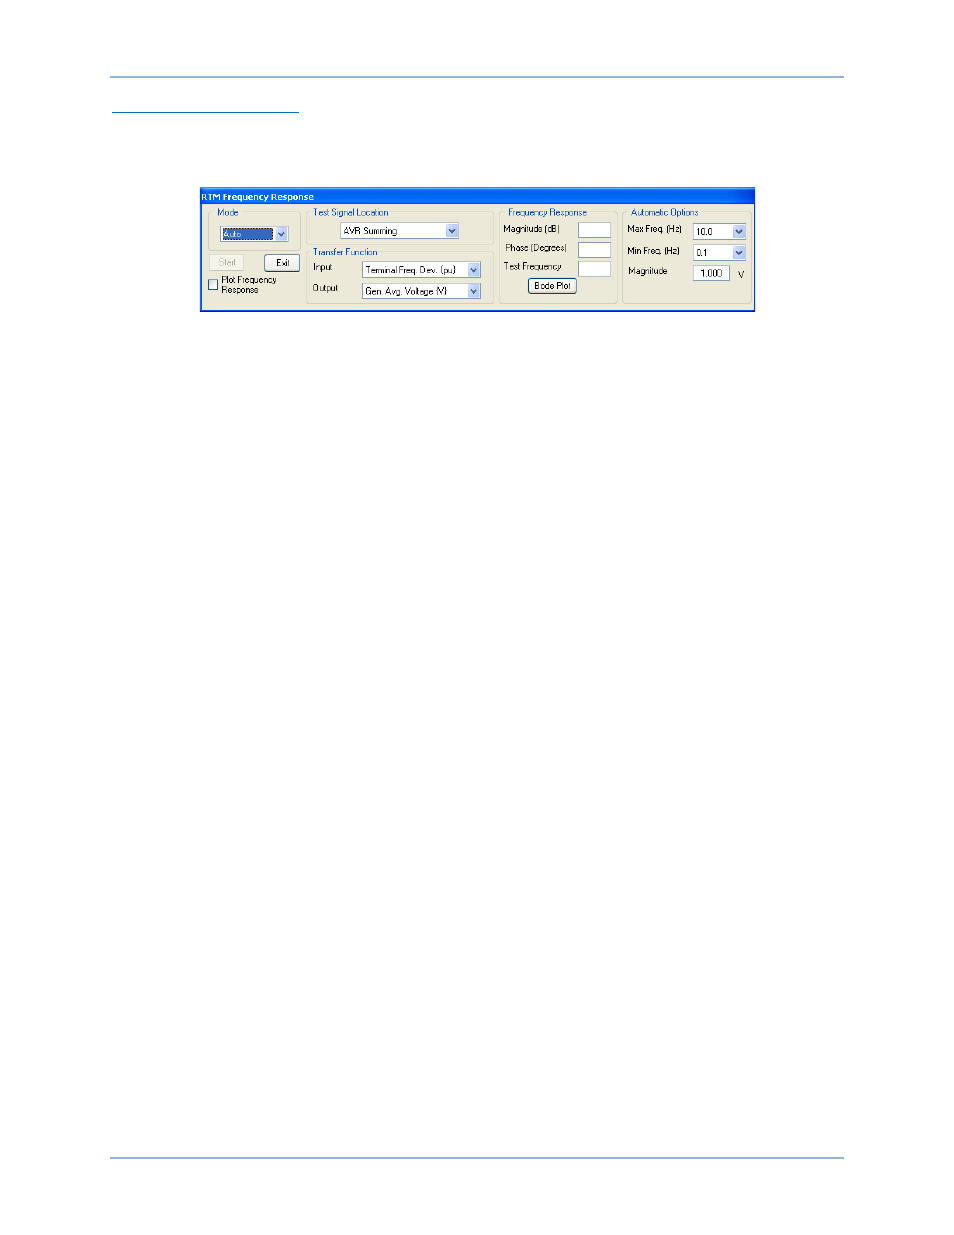
RTM Frequency Response
Clicking the Frequency Response button on the Analysis screen displays the Real-Time-Metering
Frequency Response screen shown in Figure 79. This screen’s settings and controls are described in the
following paragraphs.
Figure 79. RTM Frequency Response Screen
Mode. Either Manual mode or Auto mode may be selected. In Manual mode, a single frequency can be
specified to obtain the corresponding magnitude and phase responses. In Auto mode, BESTCOMS will
sweep the range of frequencies (determined by the Frequency (Max) and Frequency (Min) settings) and
obtain the corresponding magnitude and phase responses.
Plot Frequency Response. If selected, BESTCOMS will generate a Bode plot when requested to do so by
clicking the Bode Plot button.
Test Signal Location. This pull-down menu allows selection of the point in the DECS-400 logic circuitry
where a signal is injected for analysis of magnitude and phase responses on the Analysis screen plot.
Signal points include AVR summing, PSS Comp Frequency, PSS Electric Power, AVR PID Input, and
Manual PID Input.
Transfer Function – Input and Output. These two pull-down menus select the type of signal to be applied
and output. The available signal types are:
•
Auxiliary Voltage Input (V)
•
AVR PID Error Signal Input (V)
•
Comp. Frequency Deviation (%)
•
Control Output
•
Field Current (A)
•
Field Voltage (V)
•
Generator Average Voltage (V)
•
Generator Frequency (Hz)
•
Generator Reactive Power (kvar)
•
Generator Real Power (kW)
•
PSS Electrical Power (PU)
•
PSS Filtered Mech. Power (PU)
•
PSS Final Output (PU)
•
PSS Lead/Lag #1 (PU)
•
PSS Lead/Lag #2 (PU)
•
PSS Lead/Lag #3 (PU)
•
PSS Lead/Lag #4 (PU)
•
PSS Mech. Power LP #1 (PU)
•
PSS Mech. Power LP #2 (PU)
•
PSS Mech. Power LP #3 (PU)
•
PSS Mech. Power LP #4 (PU)
•
PSS Mechanical Power (PU)
•
PSS Post-Limit Output (PU)
•
PSS Power HP #1 (PU)
•
PSS Pre-Limit Output (PU)
•
PSS Speed HP #1 (PU)
•
PSS Synthesized Speed (PU)
•
PSS Terminal Voltage (PU)
•
PSS Torsional Filter #1 (PU)
•
PSS Torsional Filter #2 (PU)
•
PSS Washed Out Power (PU)
•
PSS Washed Out Speed (PU)
•
Terminal Frequency Deviation (%)
•
Test Signal (V)
Transfer function input/output locations are illustrated in Figure 80.
Frequency Response – Magnitude (dB). This read-only field displays the magnitude response that
corresponds to the test signal previously applied.
Frequency Response – Phase (Degrees). This read-only field displays the phase response that
corresponds to the test signal previously applied.
Frequency Response – Test Frequency. This read-only field displays the frequency of the test signal
currently being applied. Bode Plot. Clicking this button generates the magnitude and phase Bode plot.
The Bode plot can be printed and saved. An image of the magnitude plot or phase plot can be saved as a
GIF file. All graph data can also be saved as a comma-delimited format (CSV) file.
DECS-400
BESTCOMS™ Software