Flowserve Logix MD+ ValveSight User Manual
Page 133
ValveSight™ Diagnostics DTM Manual for Logix MD+ Positioner with HART®
FCD-
LGENSF0014-00
© Flowserve Corporation
133
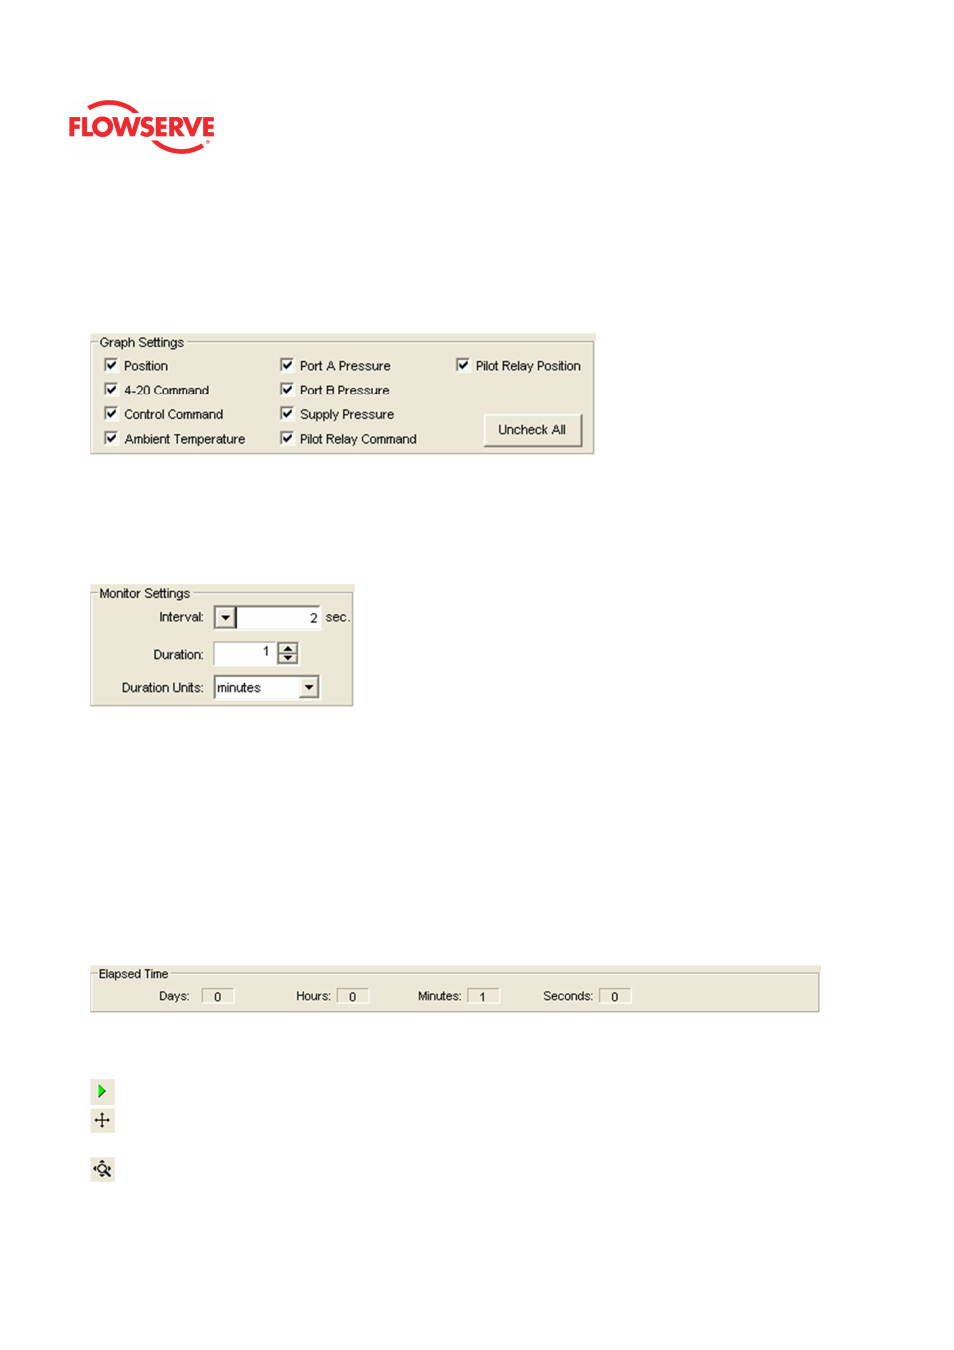
Graph Settings
This box allows for the selection of items to be shown on the graph. All of the data is
acquired regardless of this setting. Any item can be hidden or shown after the data has
been downloaded from the positioner. The "Uncheck All" button will remove all the
selected boxes.
Monitor Settings
The Monitor Settings
box sets the Interval between data points, the Duration of the logging,
and the Duration Units. Two seconds is the fastest acquisition interval for the logger (due to
the speed of HART communications). If you are on a large network, latency times may
require a longer acquisition interval.
Data Capture Timing
The data is plotted on the graph at different times depending on transmission rates. A data
sample is requested after the first interval has passed. After the data sample has been
received, the values are plotted at the next time interval. For example, if the time interval is
5 seconds and it takes 2.5 seconds to request and receive the data sample, the first data
points will be plotted at the 8th second on the graph (5 seconds + 2.5 seconds = 7.5
seconds. Then rounded up to 8 seconds). At 10 seconds, another data sample will be
requested. It will be plotted at the 13th second on the graph.
Elapsed Time
This box displays the time that has passed since the monitor was started.
Graph Settings
At the top of the graph are several controls for viewing the graph.
The Restore icon restores a graph that has been zoomed or adjusted.
The Scroll icon will allow the scales on the graph to be scrolled. Click the icon, then
dragging the scale up or down.
The Zoom icon will allow the scales on the graph to be zoomed or expanded. Click on
the scale and dragging the scale up or down to zoom in or out.