Flowserve Logix MD+ ValveSight User Manual
Page 169
ValveSight™ Diagnostics DTM Manual for Logix MD+ Positioner with HART®
FCD-
LGENSF0014-00
© Flowserve Corporation
169
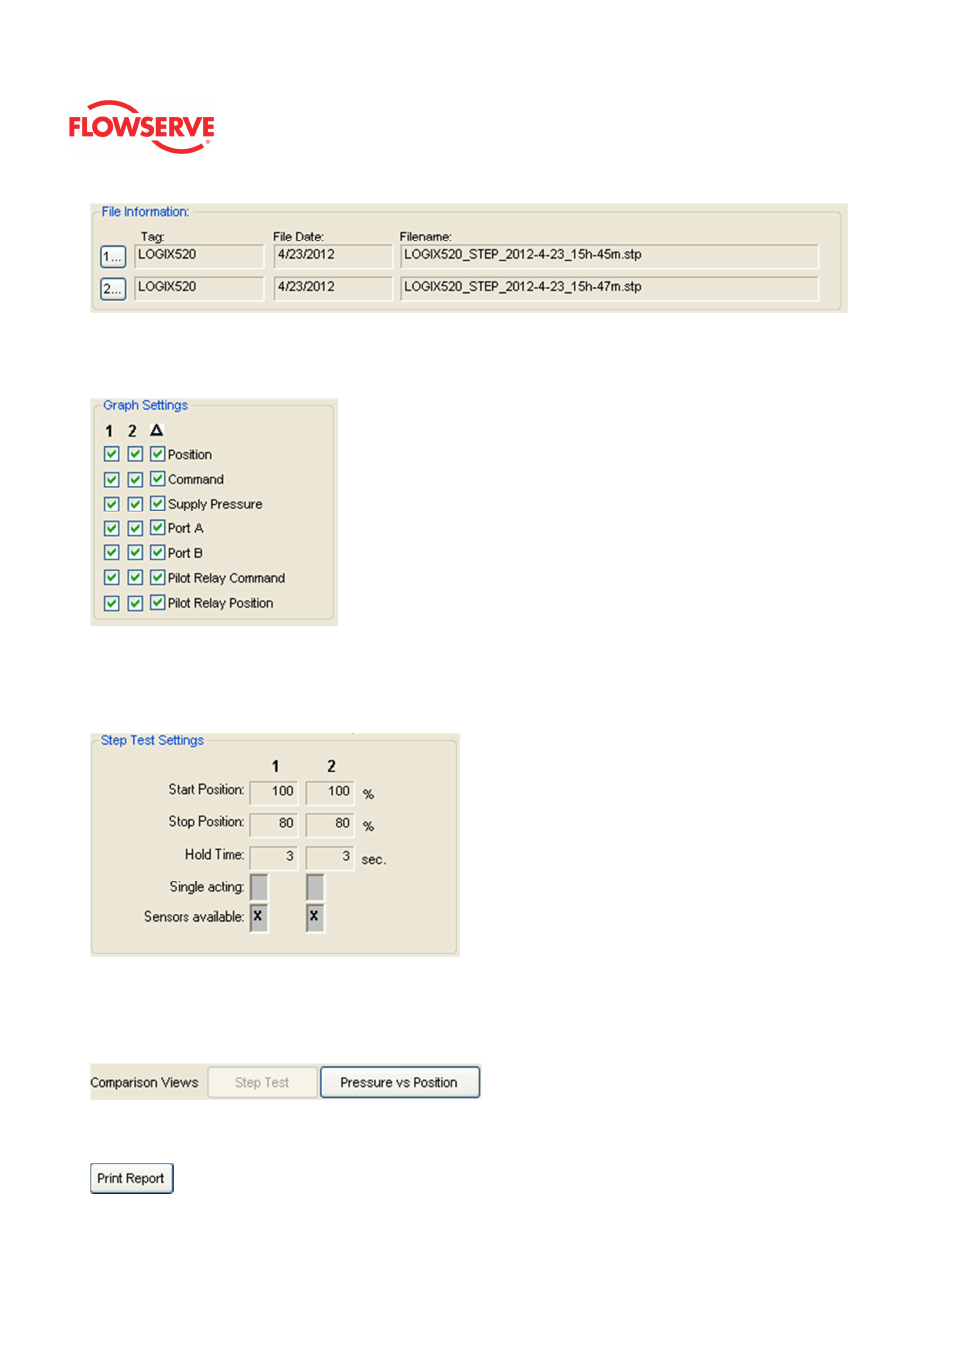
Graph Settings
This area allows for the selection of items to be shown on the graph. You can select
between data sets from file 1, file 2, and the differences.
Step Test Settings
The Step Test Settings area contains the information used to run the step test and other
information that may affect the results. This information is shown for each file in a side-by-
side comparison. Where settings differ, the name is highlighted.
Graph pages
The graphs are identical to those shown in the step test (Step Test and Pressure vs
Position) but they each show the data for both files along with differences between the two
files.
Action Buttons
The Print Report button sends the report to the default printer.