Advanced dashboard – Flowserve Logix MD+ ValveSight User Manual
Page 21
ValveSight™ Diagnostics DTM Manual for Logix MD+ Positioner with HART®
FCD-
LGENSF0014-00
© Flowserve Corporation
21
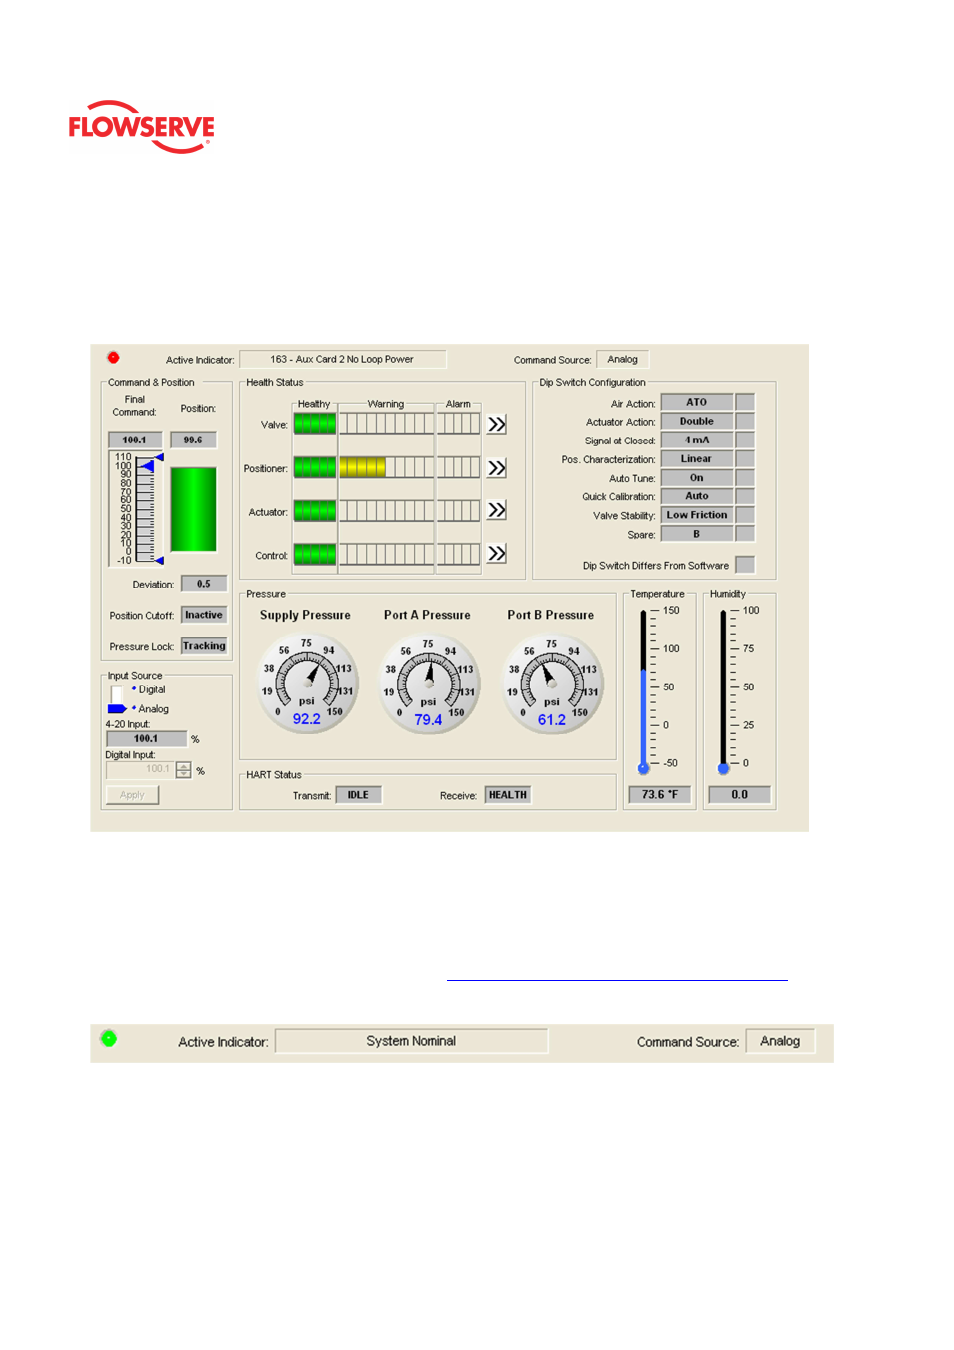
Advanced Dashboard
The Dashboard view is the main diagnostic view of the ValveSight® DTM. Generally, the
color green signifies a healthy condition, yellow signifies some degradation has taken
place, and red signifies a problem that needs to be addressed right away. You can identify
problems right away by observing any red areas on this page.
Status Area
The Active Indicator area shows the status of the most relevant active indicator. The color
of the "LED light" corresponds to the Active Indicator and the first color of the blink code
sequence on the positioner. Generally green indicates no immediate issues. Yellow
indicates a developing issue. Red indicates the ability to control may be compromised. A
detailed list of the indicators is given in the
Alarm Congfiguraion - Alarm Annunicator
page.
The Command Source field indicates weather the positioner is being controlled by digital or
an analog (4-20 mA) command source.
Command and Position
This area contains a graphical representations of the valve command and position. The
blue pointer tracks the final command value after adjustments for characterization curves,
Soft Limits, and Tight Shut Off. The green position bar indicates the current measured
position of the valve. The smaller pointers show the settings of the travel alert settings
(these can be changed on the Travel Alerts page located under Alarms/Alerts). Grayed out