Flowserve Logix MD+ ValveSight User Manual
Page 175
Advertising
ValveSight™ Diagnostics DTM Manual for Logix MD+ Positioner with HART®
FCD-
LGENSF0014-00
© Flowserve Corporation
175
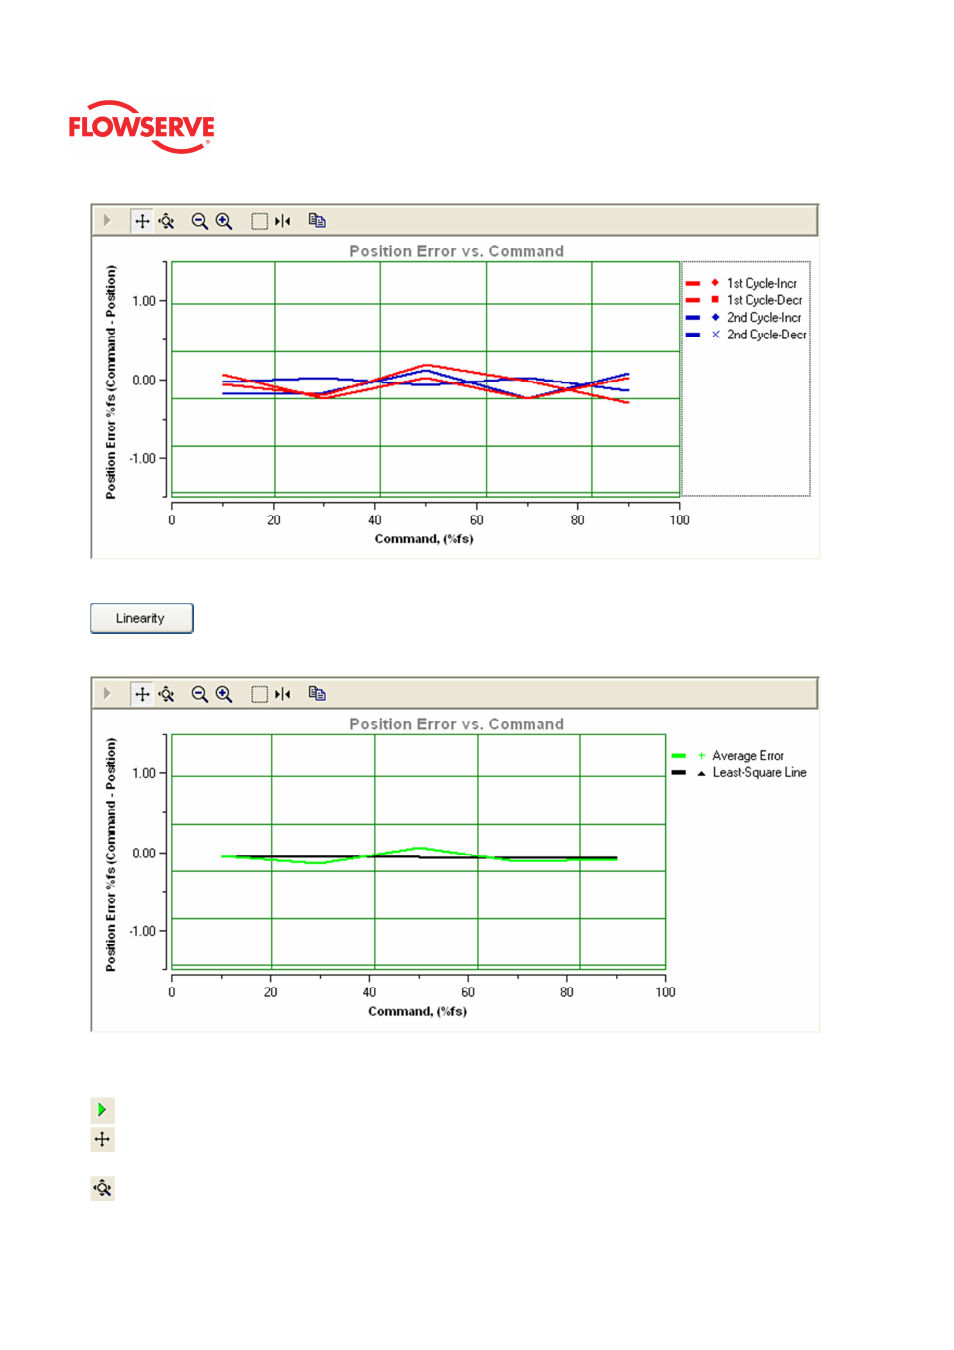
Linearity
This graph shows the position error (or how closely the valve follows a straight line) over
the commanded position.
Graph Settings
At the top of the graph are several controls for viewing the graph.
The Restore icon restores a graph that has been zoomed or adjusted.
The Scroll icon will allow the scales on the graph to be scrolled. Click the icon, then
dragging the scale up or down.
The Zoom icon will allow the scales on the graph to be zoomed or expanded. Click on
Advertising
This manual is related to the following products: