Flowserve Logix MD+ ValveSight User Manual
Page 139
ValveSight™ Diagnostics DTM Manual for Logix MD+ Positioner with HART®
FCD-
LGENSF0014-00
© Flowserve Corporation
139
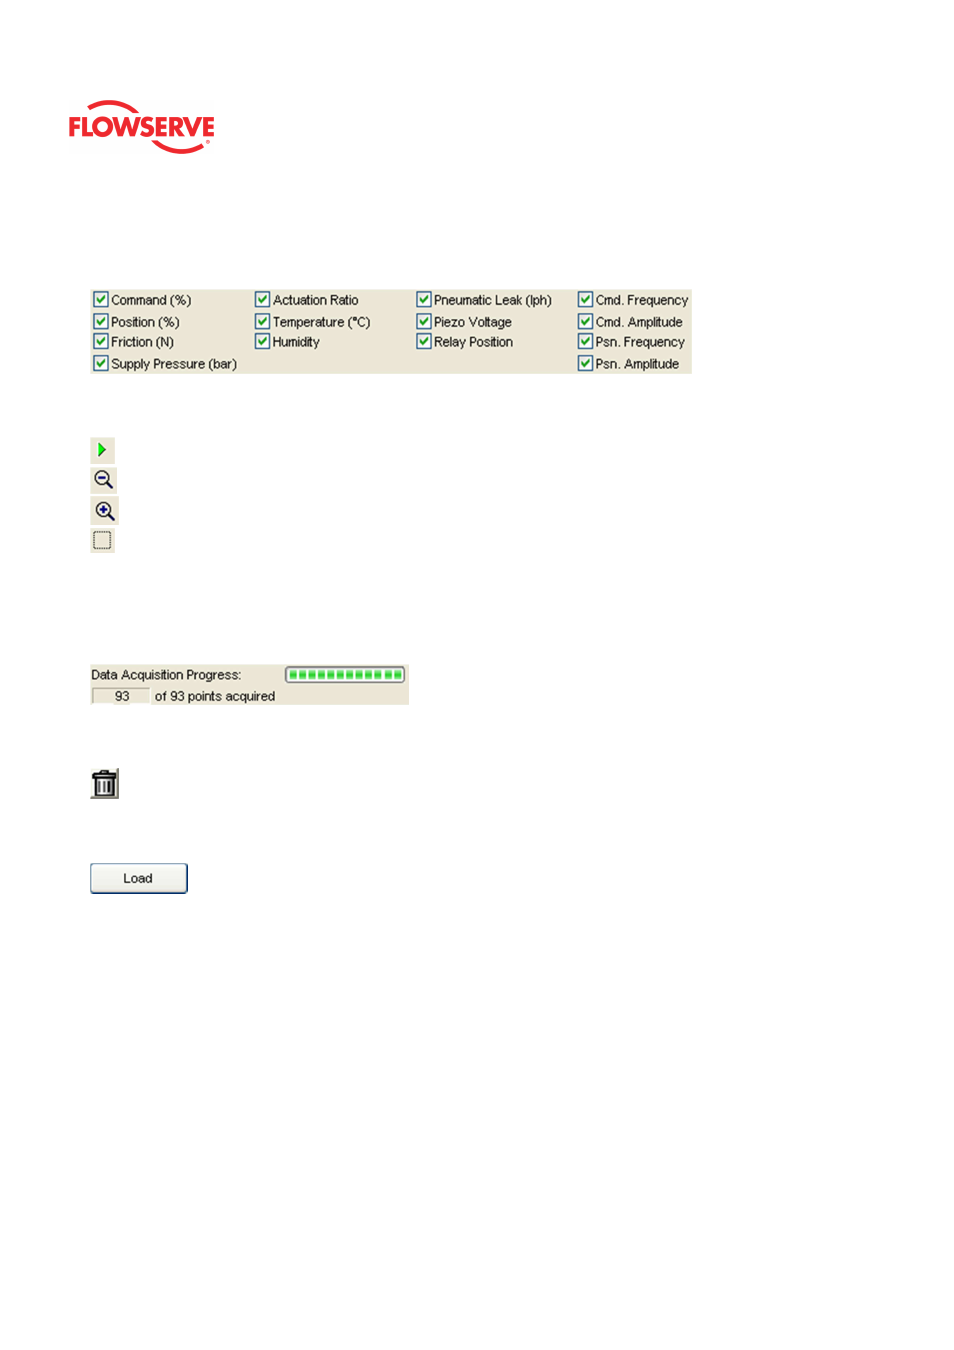
Graph Series Selection
This area allows for the selection of items to be shown on the graph. All of the data is
acquired regardless of this setting. Any item can be hidden or shown after the data has
been downloaded from the positioner.
Graph Settings
At the top of the graph are several controls for viewing the graph.
The Restore icon restores a graph that has been zoomed or adjusted.
The Zoom Out All Axes icon scales all axes by clicking on the graph.
The Zoom In All Axes icon scales all axes by clicking on the graph.
The Zoom Box icon allows a portion of the visible graph to be magnified. Click on the
icon then click and drag over the graph data to be magnified.
Data Acquisition Progress
This field shows the download progress of the trend data. Once the trend data has been
retrieved the progress bar is blank.
Reset Trends
Delete all trend data from device and graph.
Action Buttons
The Load button will load a Data Monitor test from file.
If your Frame setting allows private dialogs, the "Load" button will be enabled and it will
display an open dialog to select the desired (*.trd) trend file to load. Select a file and click
open to load a previous stored trend for viewing.