Flowserve Logix MD+ ValveSight User Manual
Page 164
ValveSight™ Diagnostics DTM Manual for Logix MD+ Positioner with HART®
FCD-
LGENSF0014-00
© Flowserve Corporation
164
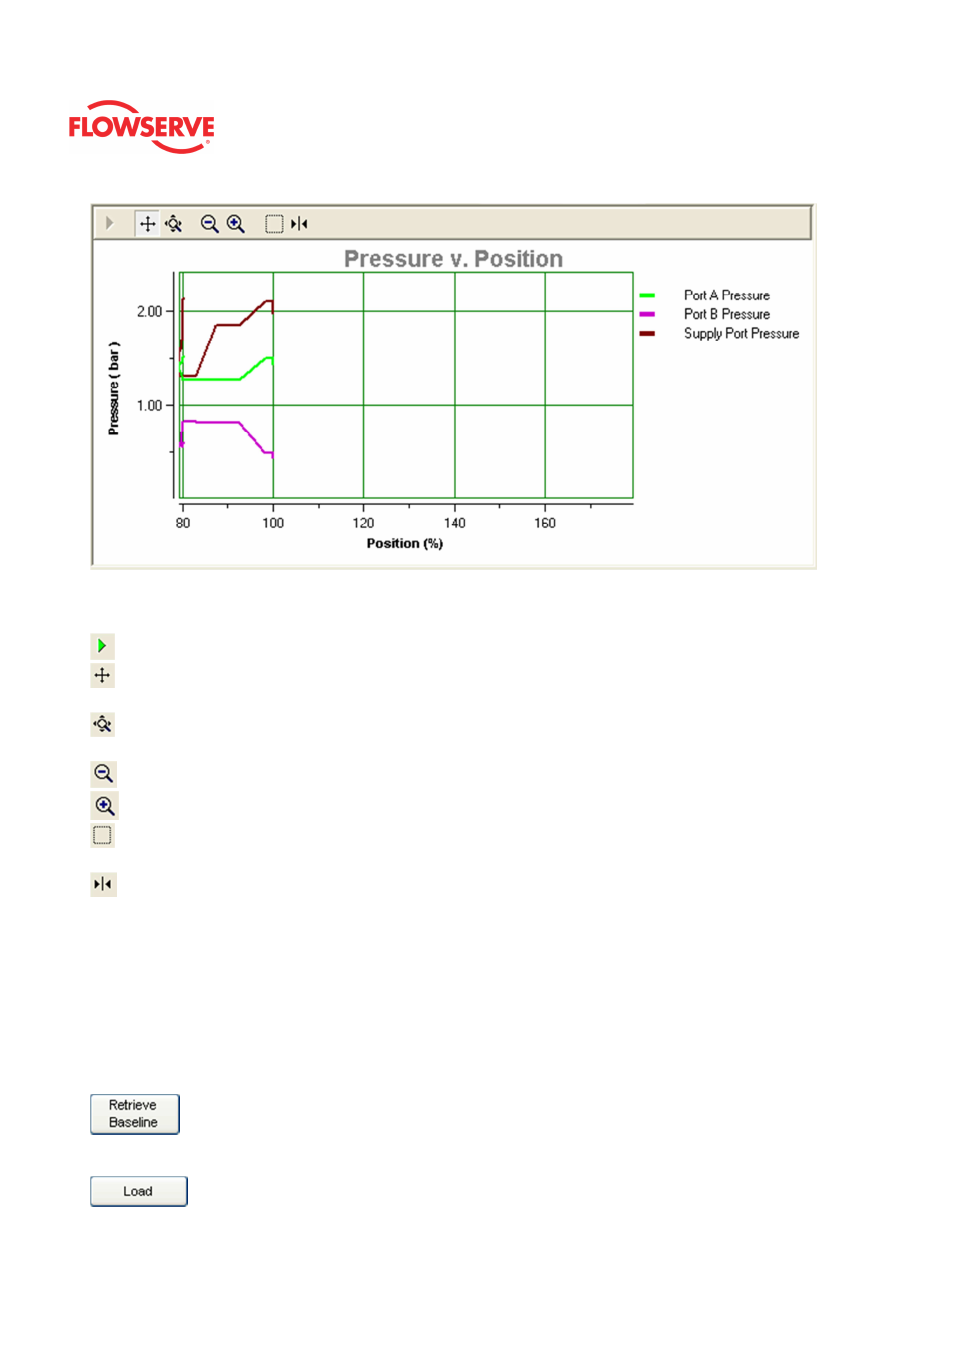
Graph Settings
At the top of the graph are several controls for viewing the graph.
The Restore icon restores a graph that has been zoomed or adjusted.
The Scroll icon will allow the scales on the graph to be scrolled. Click the icon, then
dragging the scale up or down.
The Zoom icon will allow the scales on the graph to be zoomed or expanded. Click on
the scale and dragging the scale up or down to zoom in or out.
The Zoom Out All Axes icon scales all axes by clicking on the graph.
The Zoom In All Axes icon scales all axes by clicking on the graph.
The Zoom Box icon allows a portion of the visible graph to be magnified. Click on the
icon then click and drag over the graph data to be magnified.
The Cursor icon allows a labeled marker to be placed on the graph which shows the
coordinates of the graph. Click on the icon, then select the series name from the legend on
the right of the graph. Now move the cursor to the location of interest. The first number on
the cursor shows the location on the X axis, and the second number shows the location on
the Y axis. If no variable shows in the box, a series name has not been selected.
Action Buttons
The Retrieve Baseline button clears the existing data and starts a new data acquisition from
the baseline memory of the device. The DTM menu selection is unavailable during data
acquisition.
The Load button will load a test from file.