Observing results – Fluke Biomedical Cufflink User Manual
Page 37
Operation
Preliminary Procedures
2
2-9
The Analyzer is now ready to simulate the human arm and reliably evaluate the accuracy
of the NIBP monitor.
Observing Results
Results of the analysis are provided by the Analyzer
Makearm
display, shown in Figure
2-5.
200
160
120
40
0
10
C
u
ff Press
u
re
in mmHg
Elapsed time in seconds
Heart Rate Indicator
(appears d
u
ring testing)
C
u
rrent BP
Target
V
al
u
e
MAP
C
u
ff Press
u
re
W
a
v
eform
(dra
w
n d
u
ring testing)
Meas
u
red
parameters
C
u
ffPres
C
u
ffPeak
DeflRate
DeflTime
InflRate
InflTime
TotlTime
120/
8
0
0
162
5.1
17.5
46.7
3.3
22.0
(90) A
20
30
8
0
fcv016.eps
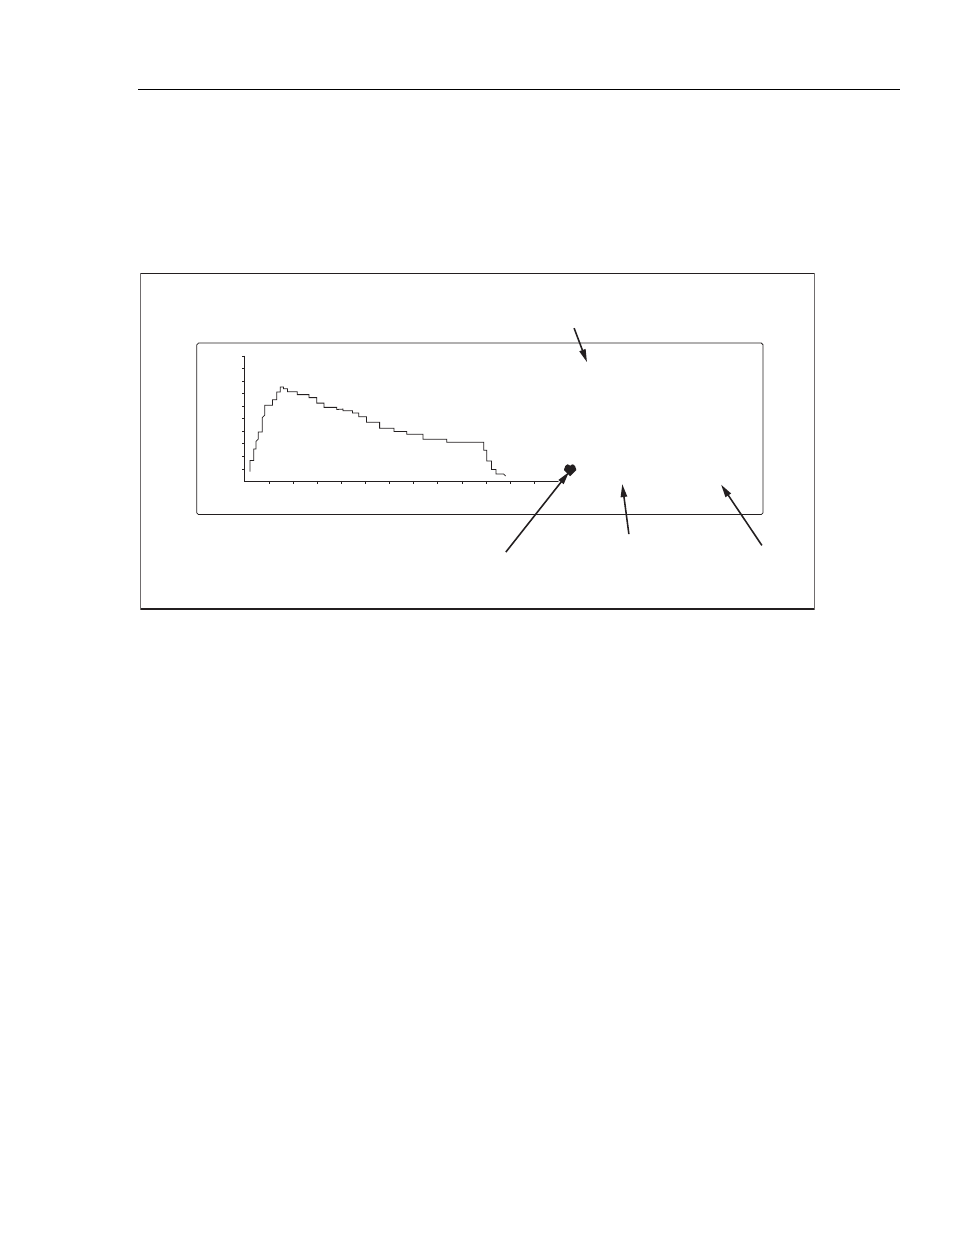
Figure 2-5. Makearm Display of Test Results
The
Makearm
display includes a graph, the vertical axis of which indicates the cuff
pressure in millimeters of mercury (mmHg). The horizontal axis indicates elapsed time in
seconds. The graph is auto-ranging; if the cuff pressure curve values extend beyond the
displayed ranges, the entire graph is redrawn on the display to make the curve appear
more compact.
On the right side of the display are listed the measured test parameters, as defined in
Table 2-2.