Device monitoring, Configuration guide, Event analysis – H3C Technologies H3C SecCenter UTM Manager User Manual
Page 203: Event overview
195
Device monitoring
In addition to the attack event information of the entire network, the firewall management component
also allows you to view the attack event information of every firewall device.
Configuration guide
From the navigation tree of the firewall management component, select Device Monitoring under Events
Monitor to enter the device monitoring page, as shown in
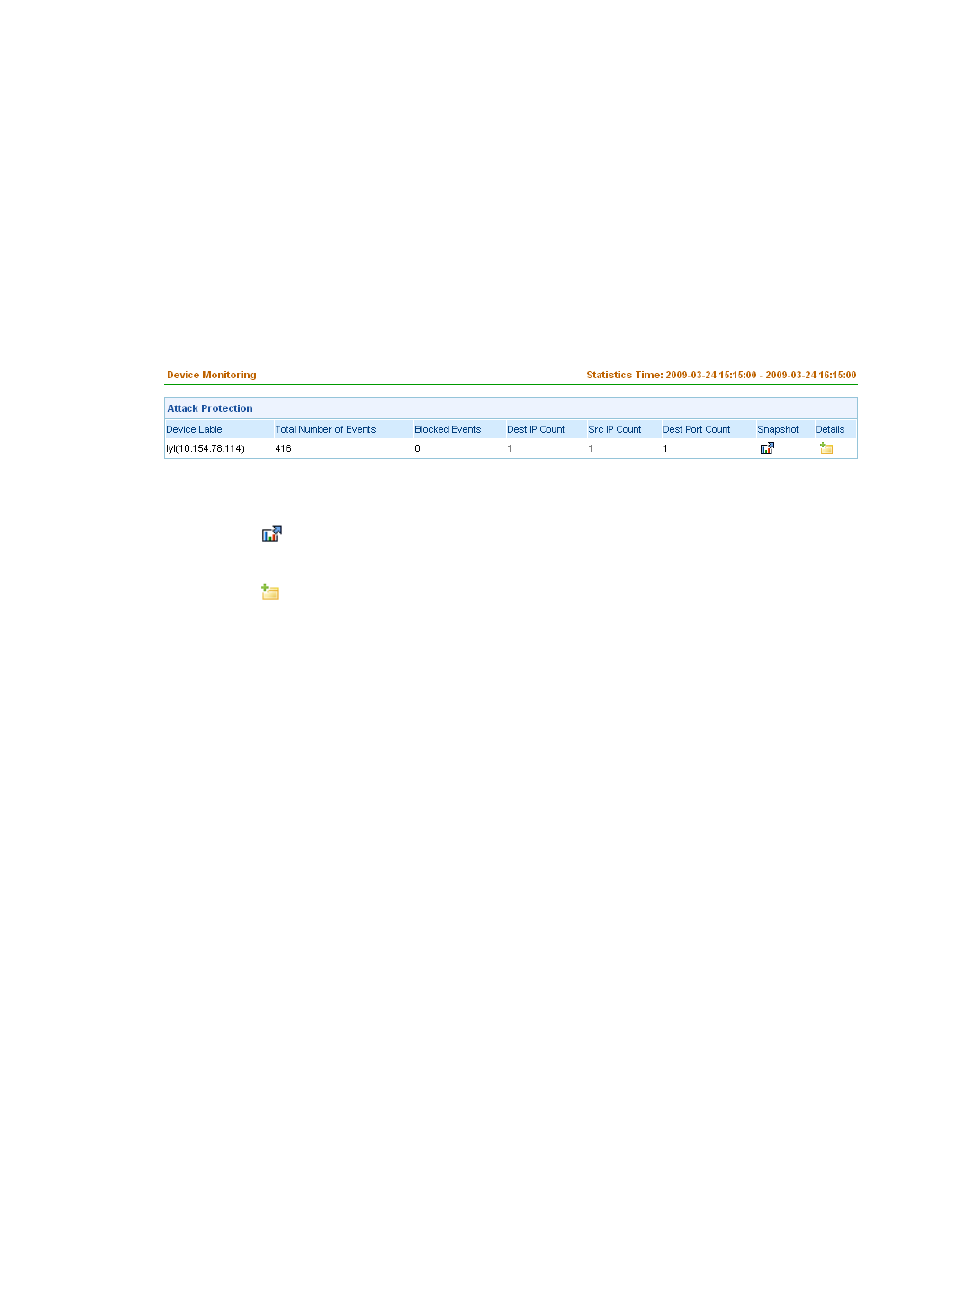
. The page presents the attack
protection information in the last hour by device, including the total number of events, number of blocked
events, number of source/destination IP addresses, and number of destination ports.
Figure 187 Device monitoring
In the list, you can:
•
Click the
icon in the Snapshot column of a firewall device to enter the attack event snapshot
page of the device. For more information, see “
•
Click the
icon in the Details column of a firewall device to enter the attack event details page of
the device. For more information, see “
.”
The firewall management component features comprehensive analysis and statistics reports, through
which you can evaluate the network security status in real time, and take attack prevention measures
accordingly.
Event analysis
Event overview
The system supports comprehensive analysis of attack events, including:
•
Attack event trend analysis during a day, week, month, and a customized period
•
TopN statistics reports by event, destination IP address, source IP address, destination port, and
protocol. You can export the reports.
Configuration guide
From the navigation tree of the firewall management component, select Event Overview under Event
Analysis. The attack event trend page appears by default, as shown in
. This page allows you
to view attack event trend analysis during a day, week, month, or a customized period of time. This page
shows a trend graph comparing the counts of blocked attack events and the other attack events as well
as a trend graph of attack events by severity level. Under the trend graphs is a list showing the detailed
attack event statistics, including the number of events, number of blocked events, and number of events
of each severity level.