Level-2 service traffic distribution, Figure 60 – H3C Technologies H3C SecCenter UTM Manager User Manual
Page 74
Advertising
66
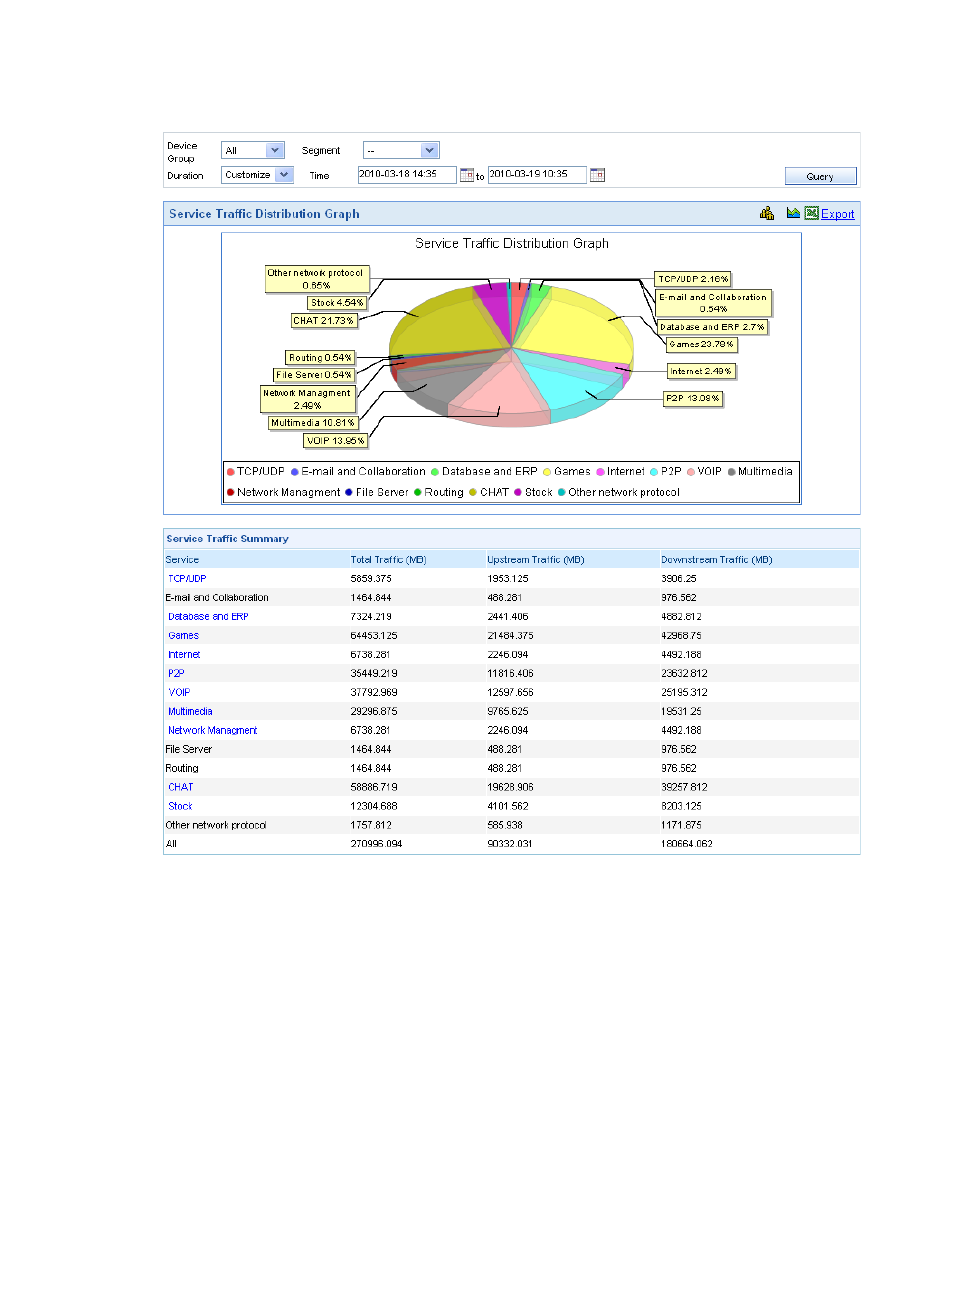
Figure 60 Level-1 service traffic distribution report page
Level-2 service traffic distribution
Similarly, the level-2 service traffic distribution report page is divided into two areas:
•
The upper area displays service traffic distribution of services of the same type in a pie chart.
•
The lower area lists the service traffic summary.
See
for the service traffic distribution query options.
Advertising