Operating system language statistics report—list, Figure – H3C Technologies H3C Intelligent Management Center User Manual
Page 196
Advertising
180
Figure 18 Statistics report by operating system version—List
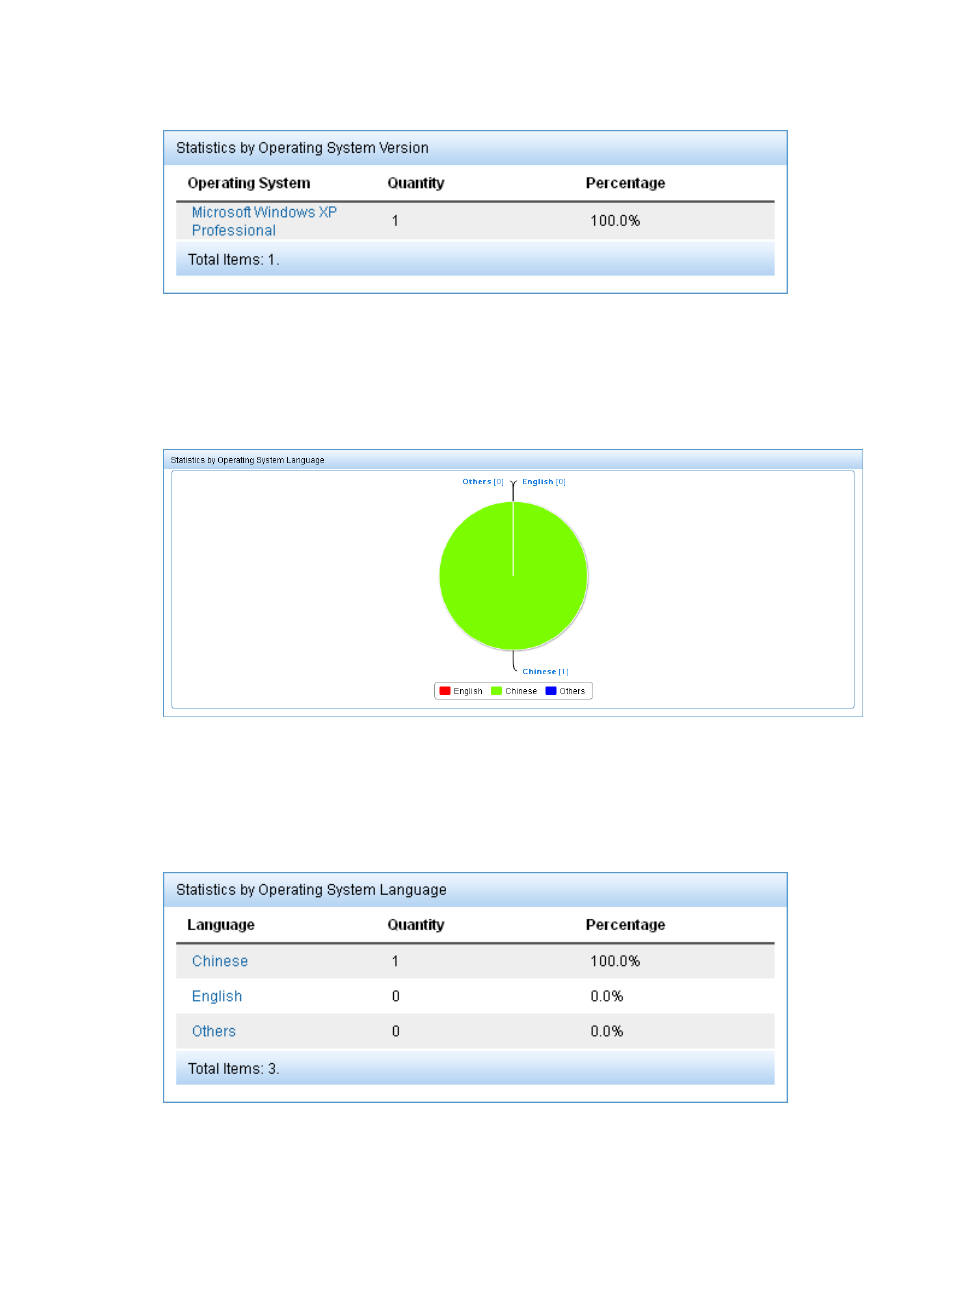
Operating system language statistics report—Pie chart
This report displays, in a pie chart, the number of operating systems using each language and their
proportion, as shown in
Figure 19 Statistics report by operating system language—Pie chart
Operating system language statistics report—List
This report lists the number of operating systems using each language and their proportion, as shown
in
.
Figure 20 Statistics report by operating system language—List
Advertising