All-node online users 24-hour trend graph fields, Asset information report – H3C Technologies H3C Intelligent Management Center User Manual
Page 260
244
•
Report Time—Time when the report was generated.
•
Description—A brief description of the report.
All-node online users 24-hour trend graph fields
•
Number of online users—Displays the total number of online users for all nodes at each hour of a
24 hour period, including the secure online users, insecure online users, and unknown online users.
•
Number of secure online users—Displays the total number of secure online users for all nodes at
each hour of a 24 hour period.
•
Number of insecure online users—Displays the total number of insecure online users for all nodes
at each hour of a 24 hour period.
•
Number of unknown online users—Displays the total number of unknown online users for all nodes
at each hour of a 24 hour period.
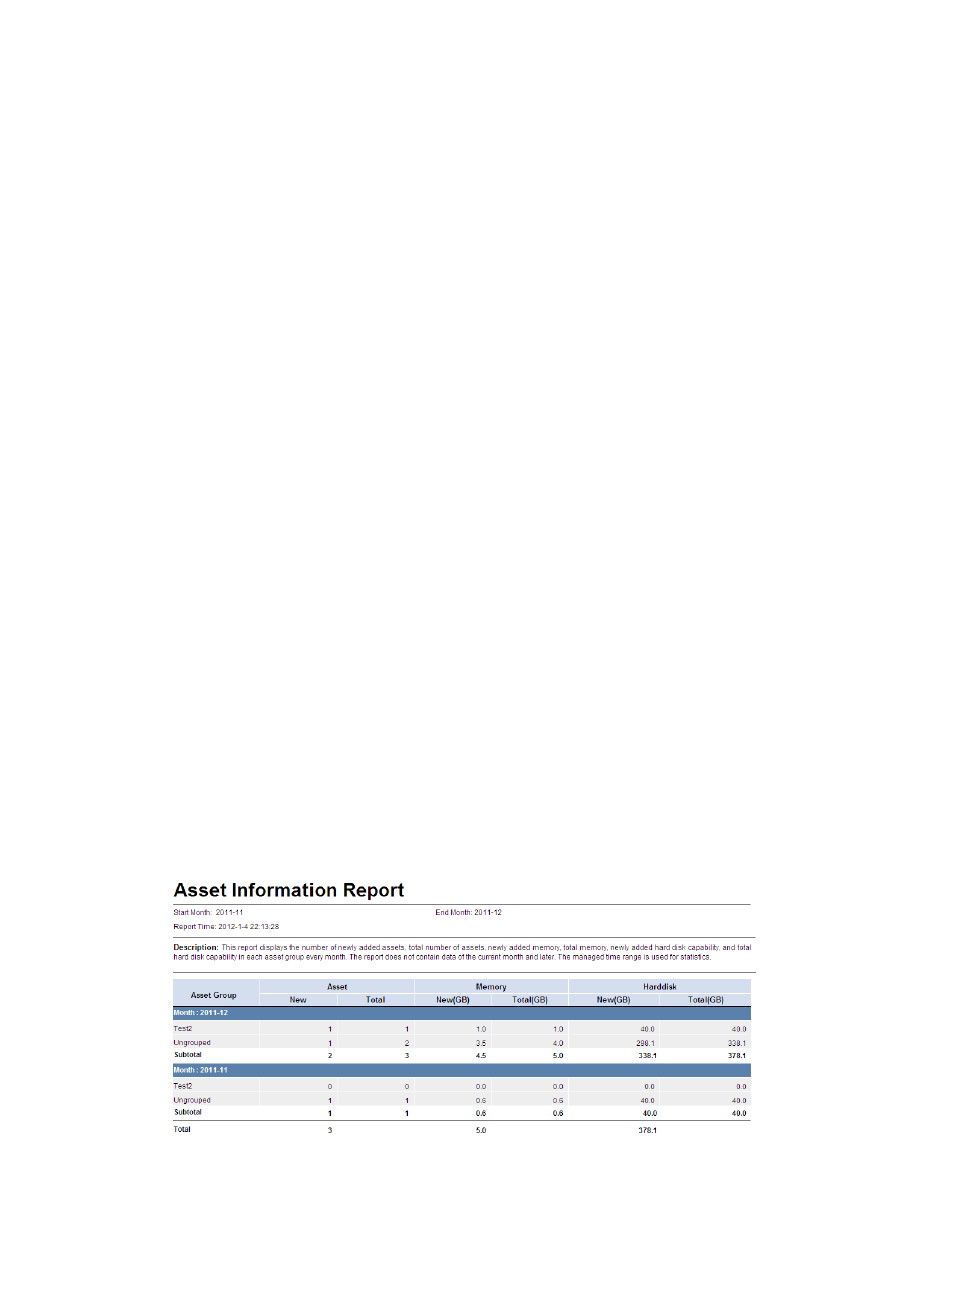
Asset information report
This report collects statistics about newly added and existing assets, memory size, and hard-disk
capacity of an asset group (excluding its subgroups) during each month during a specified time range.
The report displays only statistics for asset groups to which the current operator has privileges, and does
not include the asset statistics for the current month.
To view the asset information report:
1.
Click the Report tab.
2.
Click the Asset Information Report link in the My Real-Time Reports [Edit Mode] area. (Verify that
this link displays [Edit Mode], as this confirms that you are in view mode.)
The Set Parameter dialog box appears.
3.
In the Start Month area, select the start month for report statistics collection. In the End Month area,
select the end month for report statistics collection.
The asset statistics of the current month are not included in the report.
4.
Click OK.
The asset information report appears in an Intelligent Analysis Report Viewer page, as shown
in
Figure 23 Asset information report