Illegal peripheral use statistics pie chart, Illegal peripheral usage type statistics, Insecurity category statistic report – H3C Technologies H3C Intelligent Management Center User Manual
Page 269
253
Illegal peripheral use statistics pie chart
The pie chart displays the distribution of illegal peripheral usage types during a specified time range. The
illegal peripheral usage types are USB Storage, USB Nonstorage, DVD/CD-ROM, Floppy, PCMCIA,
COM/LPT, Infrared, Bluetooth, 1394, and Modem. Click a slice in the pie chart to see statistics about the
type of illegal peripheral usage.
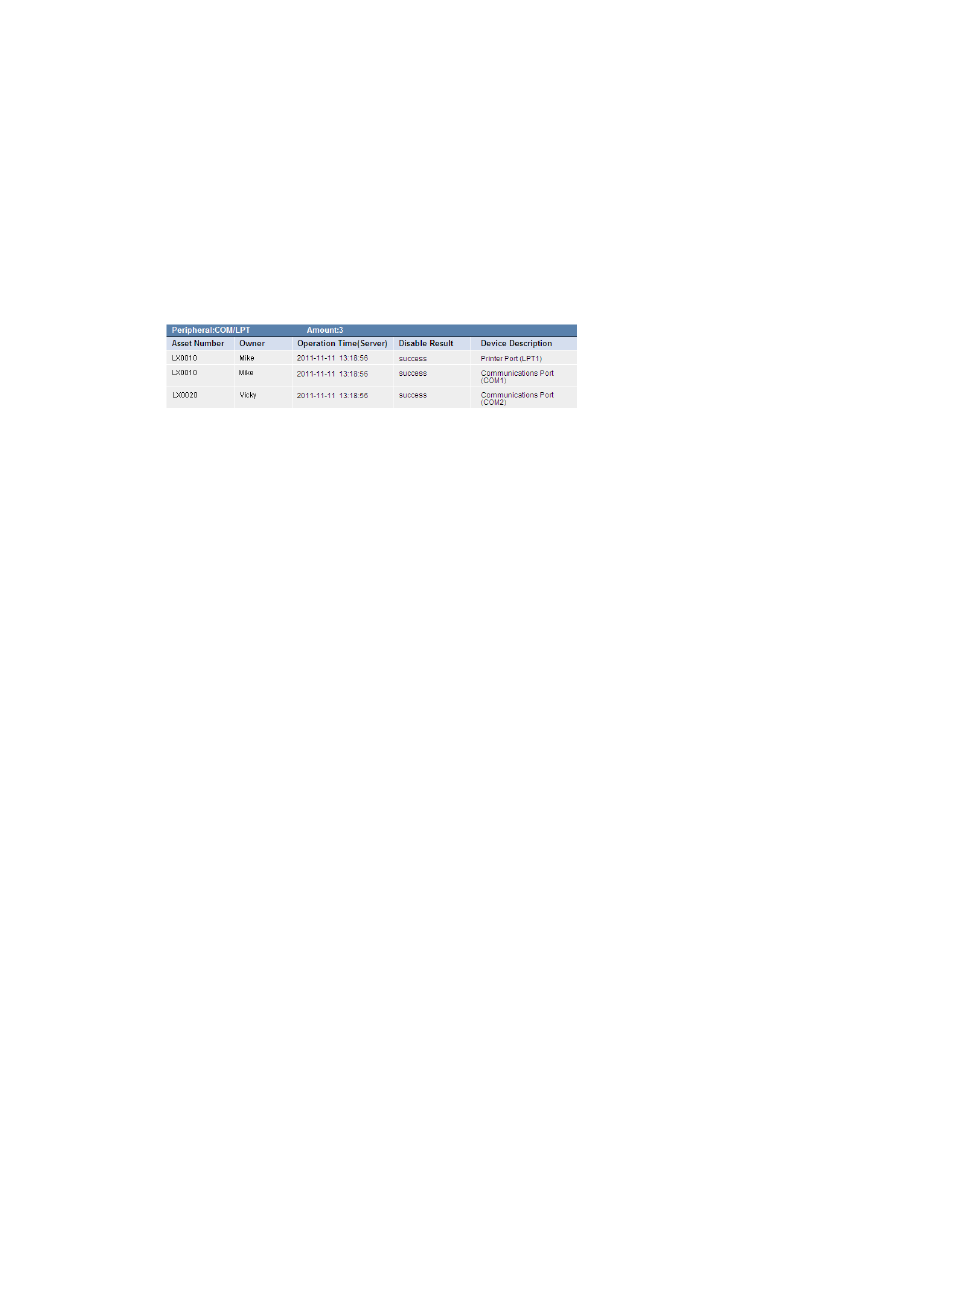
Illegal peripheral usage type statistics
shows statistics about the illegal peripheral usage type.
Figure 32 Illegal peripheral usage type statistics
•
Peripheral—Type of peripheral usage whose statistics are collected.
•
Amount—Number of times of the illegal peripheral use occurred.
•
Asset Number—Asset number of the asset.
•
Owner—Owner of the asset.
•
Operation Time—Time when the server recorded the illegal peripheral usage.
•
Disable Result—Indicates whether the iNode client successfully disables the illegal peripheral.
•
Device Description—Description of the peripheral illegally used.
Insecurity category statistic report
This report collects statistics about security check failures of each insecurity category type for the current
EAD node during a specified time range.
To view the insecurity category statistic report:
1.
Click the Report tab.
2.
Click the Insecurity Category Statistic Report link in the My Real-Time Reports [Edit Mode] area.
(Verify that this link displays [Edit Mode], as this confirms that you are in view mode.)
The Set Parameter dialog box appears.
3.
Click the Start Date field, and select the start date in a calendar.
This parameter sets the start date for the specific time range in a data collection period.
4.
Click the End Date field, and select the end date in a calendar.
This parameter sets the end date for the specific time range in a data collection period.
5.
Click OK.
The insecurity category statistic report appears in an Intelligent Analysis Report Viewer page, as
shown in
.