Single-node online users 24-hour trend graph – H3C Technologies H3C Intelligent Management Center User Manual
Page 286
270
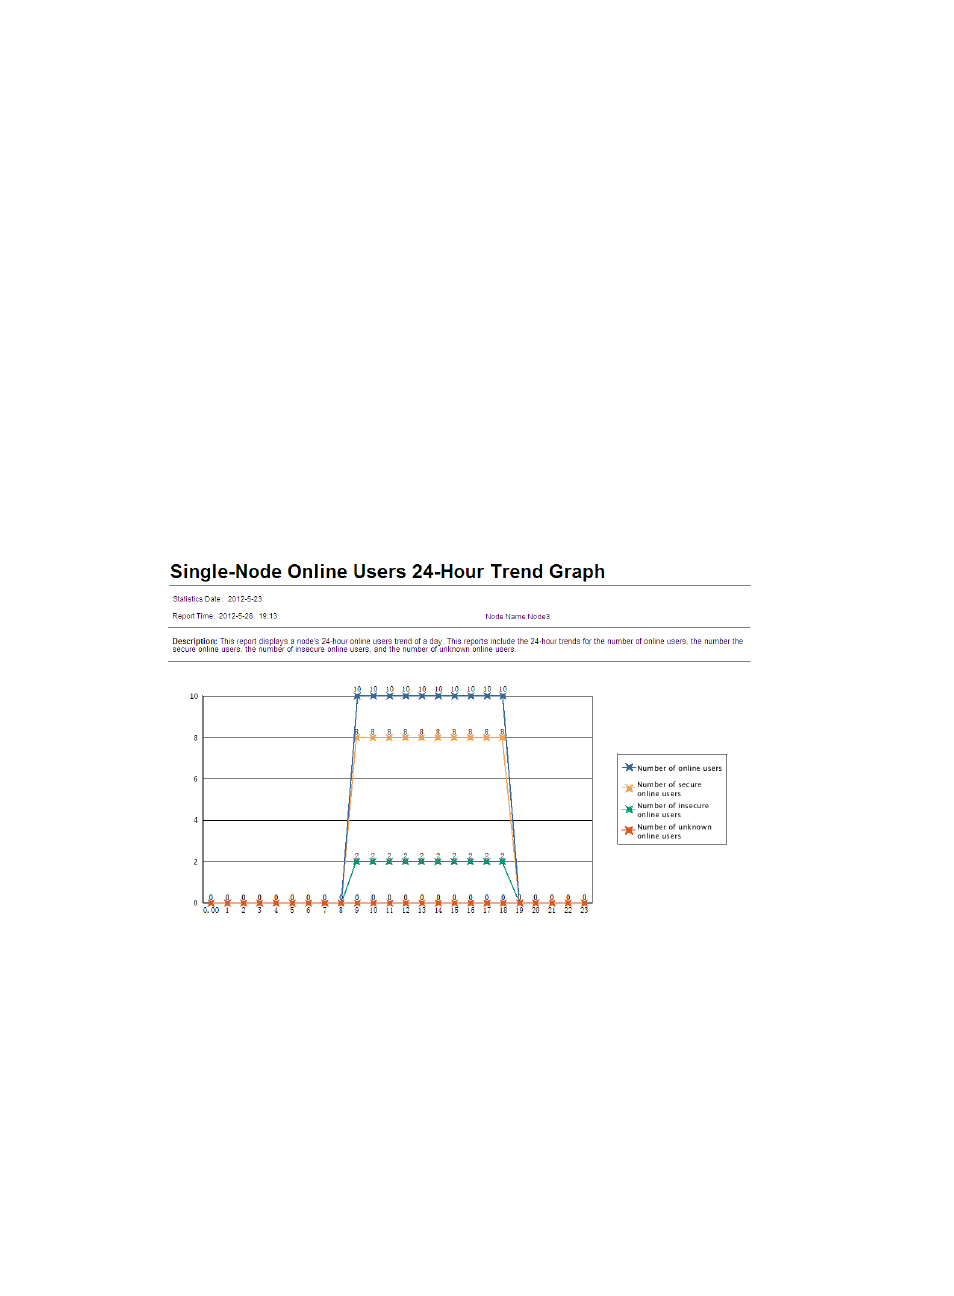
Single-node online users 24-hour trend graph
This report displays the number of online users on a single EAD node at each hour of the specified day.
Online users are categorized as secure online users, insecure online users, and unknown online users.
The total number of online users is the sum of the number of online users of each type.
To view the single-node online users 24-hour trend graph:
1.
Click the Report tab.
2.
Click the Single-Node Online Users 24-Hour Trend Graph link in the My Real-Time Reports [Edit
Mode] area. (Verify that this link displays [Edit Mode], as this confirms that you are in view mode.)
The Set Parameter dialog box appears.
3.
Click the Query Date field to select the date in a calendar.
4.
From the Grade Node list, select the node whose statistics are to be collected.
The system collects the number of online users on the node at each of the 24 hours in the day.
5.
Click OK.
The single-node online users 24-hour trend graph appears in an Intelligent Analysis Report Viewer
page, as shown in
Figure 49 Single-node online users 24-hour trend graph
Single-node online users 24-hour trend graph parameters
•
Statistics Time—Day for which statistics were collected by the report.
•
Report Time—Time when the report was generated.
•
Node Name—Name of the node whose statistics were collected.
•
Description—A brief description of the report.