Multi-node user counts comparison chart parameters – H3C Technologies H3C Intelligent Management Center User Manual
Page 278
262
The system collects the number of users for the current node and its child nodes and generates a
chart to compare the users of multiple nodes during the statistics time.
The statistics time is calculated as follows: the system deducts the delay from the query time, and
then rounds the result down to a multiple of half an hour. For example, when the query time is
2011-07-01 08:07:00 and the delay is 5 minutes, the report collects the statistics of 2011-07-01
08:00:00. When you modify the delay to 10 minutes, the system collects the statistics of
2011-07-01 07:30:00.
5.
Select the nodes whose user counts you want to compare.
The available node list contains the nodes whose statistics can be collected and compared. The
selected node list contains the nodes whose statistics are to be collected and compared. You can
hold down Ctrl and click to select multiple nodes at one time.
{
Click the Add icon
to add one or more nodes on the available node list to the selected
node list.
{
Click the Add all icon
to add all nodes on the available node list to the selected node list.
{
Click the Remove icon
to remove one or more nodes from the selected node list.
{
Click the Remove all icon
to remove all nodes from the selected node list.
6.
Click OK.
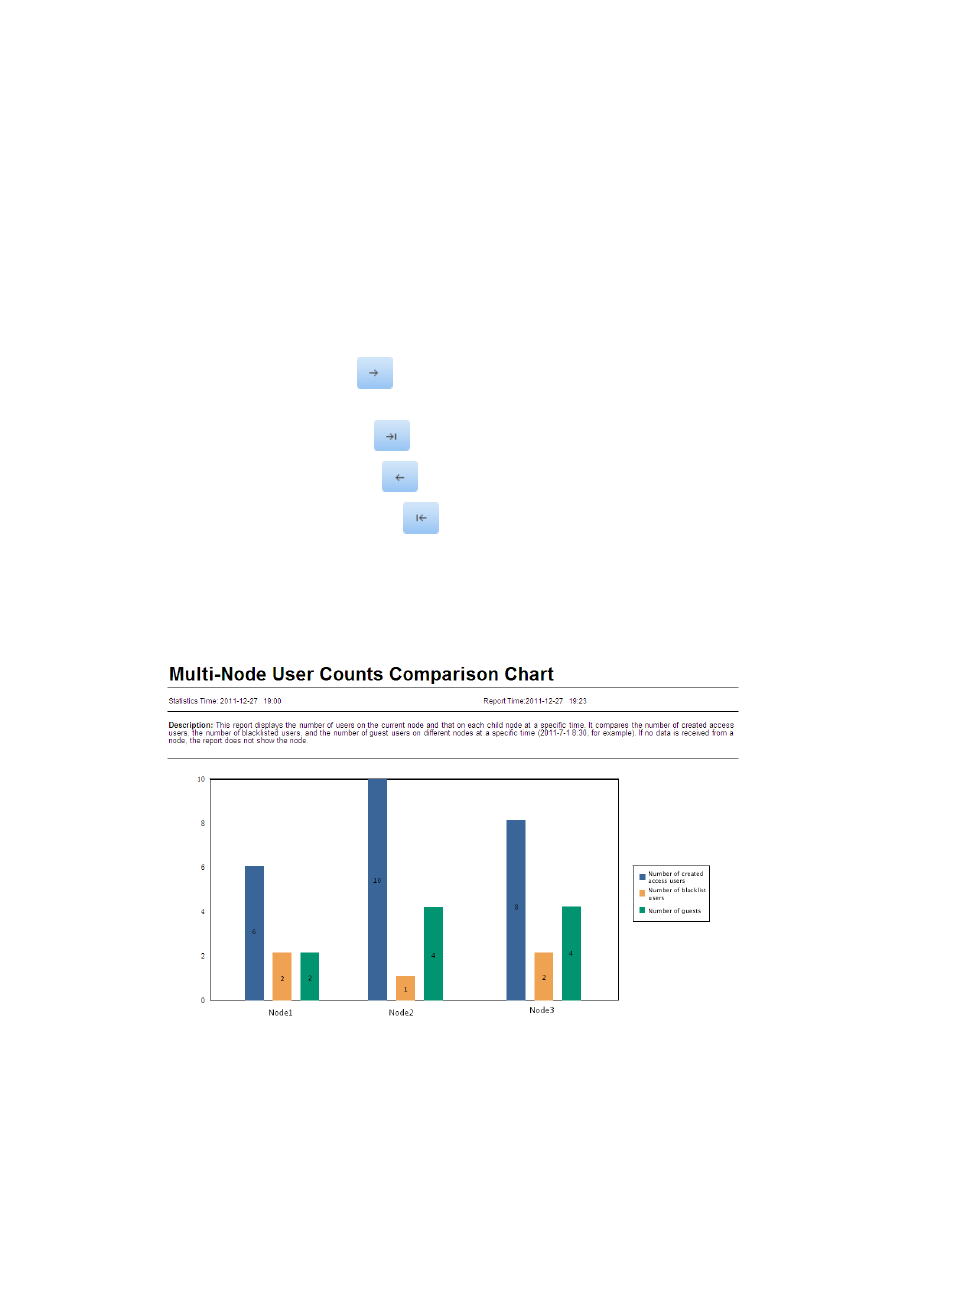
The multi-node user counts comparison chart appears in an Intelligent Analysis Report Viewer
page, as shown in
Figure 39 Multi-node user counts comparison chart
Multi-node user counts comparison chart parameters
•
Statistics Time—Time when statistics are collected by the report.
•
Report Time—Time when the report is generated.
•
Description—A brief description of the report.