2 status | performance | graphs – Comtech EF Data CDM-625A User Manual
Page 308
CDM-625A Advanced Satellite Modem
MN-CDM625A
Ethernet-based Remote Product Management
Revision 3
7–78
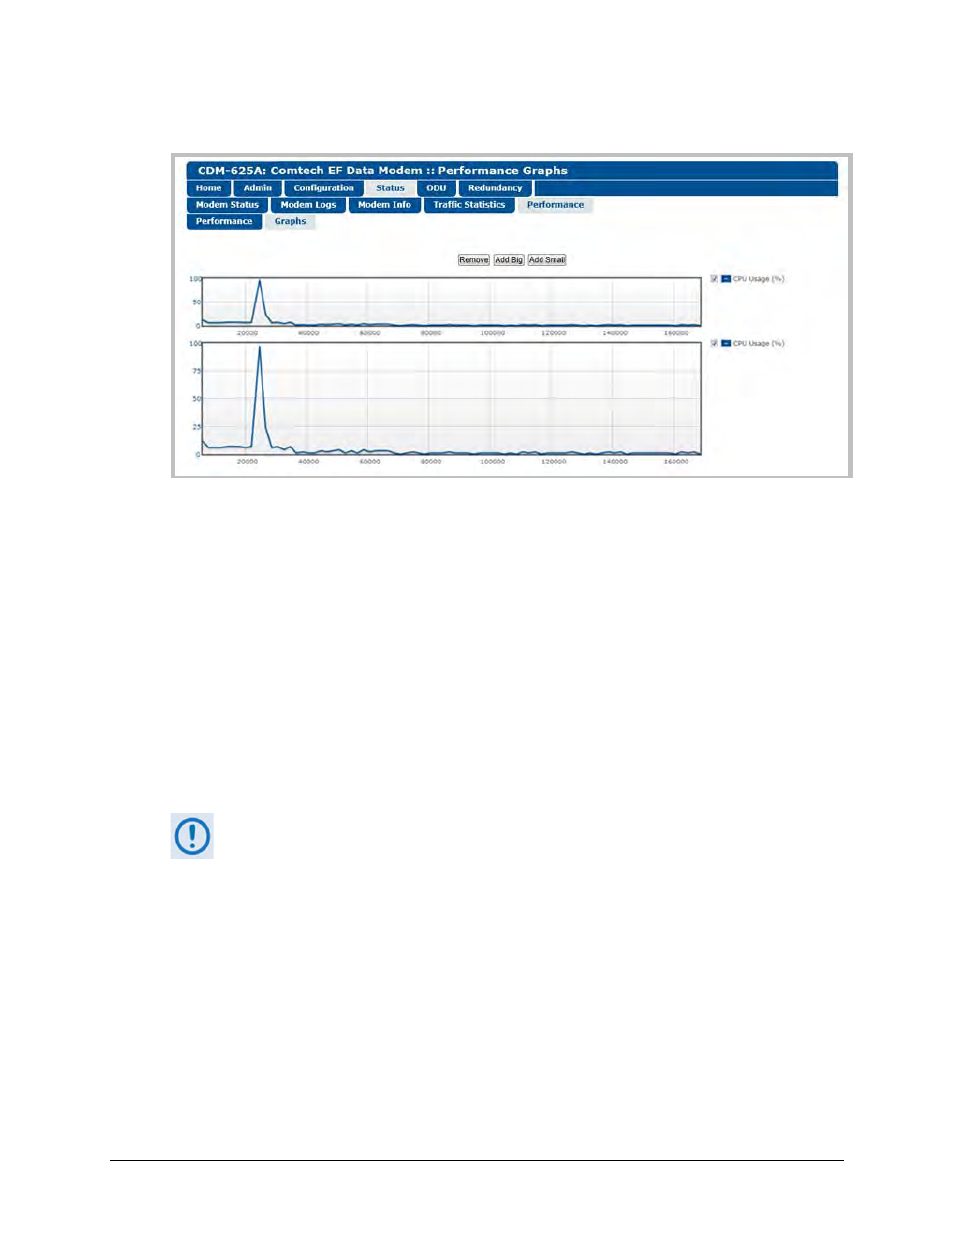
7.5.4.4.5.2 Status | Performance | Graphs
Figure 7-47. Status | Performance | Graphs page
Use this page to view a graphical representation of the CDM-625A performance. The displayed
graphs automatically update in real time.
Typical for both line graph types, the X-axis denotes elapsed time; the Y-axis denotes
performance, in percent. Either graph scrolls from right to left as viewing time increments.
Click [Add Big] to display a line graph with an extended scale Y-axis.
Click [Add Small] to display a line graph with a compressed scale Y-axis.
For either line graph, use the component check box, located to the right of each graph, to select
that graph’s viewable parameter. The line graph will update to incorporate performance
tracking for that item.
At present, ‘CPU Usage (%)’ is the only selectable parameter; more functionality
will be available in future firmware releases.
Each new graph is added to the bottom of the scrollable page. Any combination of graph types
may be displayed on this page. Click [Remove] to delete the bottom-most graph from the page.