Bandwidth utilization (out) (%) – topn, Figure 13 – H3C Technologies H3C Intelligent Management Center User Manual
Page 63
49
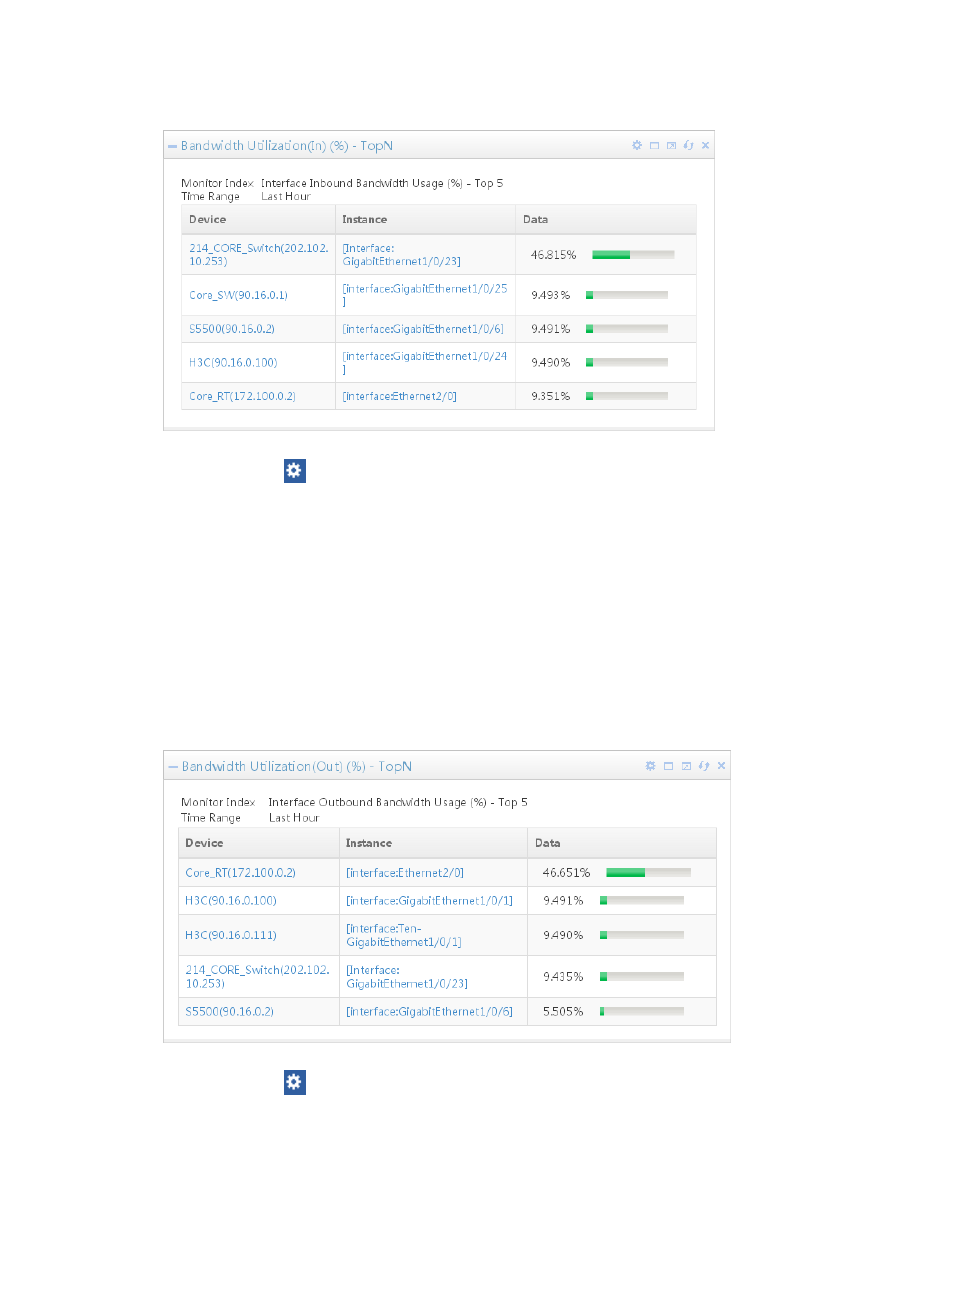
Figure 13 Bandwidth utilization (In)
Click the Set icon
on the top right corner of the widget and select Setting to launch the Setting dialog
box.
•
Time Range—Specifies the time range for statistics collection. The available options include Last
Hour, Today, Yesterday, This Week, Last Week, This Month, Last Month, This Year, and Last Year.
•
Top—Specifies the number of devices for the widget. The available options include 5, 10, 20, and
30.
Bandwidth utilization (Out) (%) – TopN
By default, the Bandwidth Utilization (Out) table, shown in
, displays the top 5 devices with the
highest outbound traffic bandwidth utilization within the last hour. The content includes the time range,
device name, IP, and the Interface Out-Bandwidth Usage.
Figure 14 Bandwidth utilization (Out)
Click the Set icon
on the top right corner of the widget and select Setting to launch the Setting dialog
box.
•
Time Range—Specifies the time range for statistics collection. The available options include Last
Hour, Today, Yesterday, This Week, Last Week, This Month, Last Month, This Year, and Last Year.