Device view, Ip topology – H3C Technologies H3C Intelligent Management Center User Manual
Page 66
52
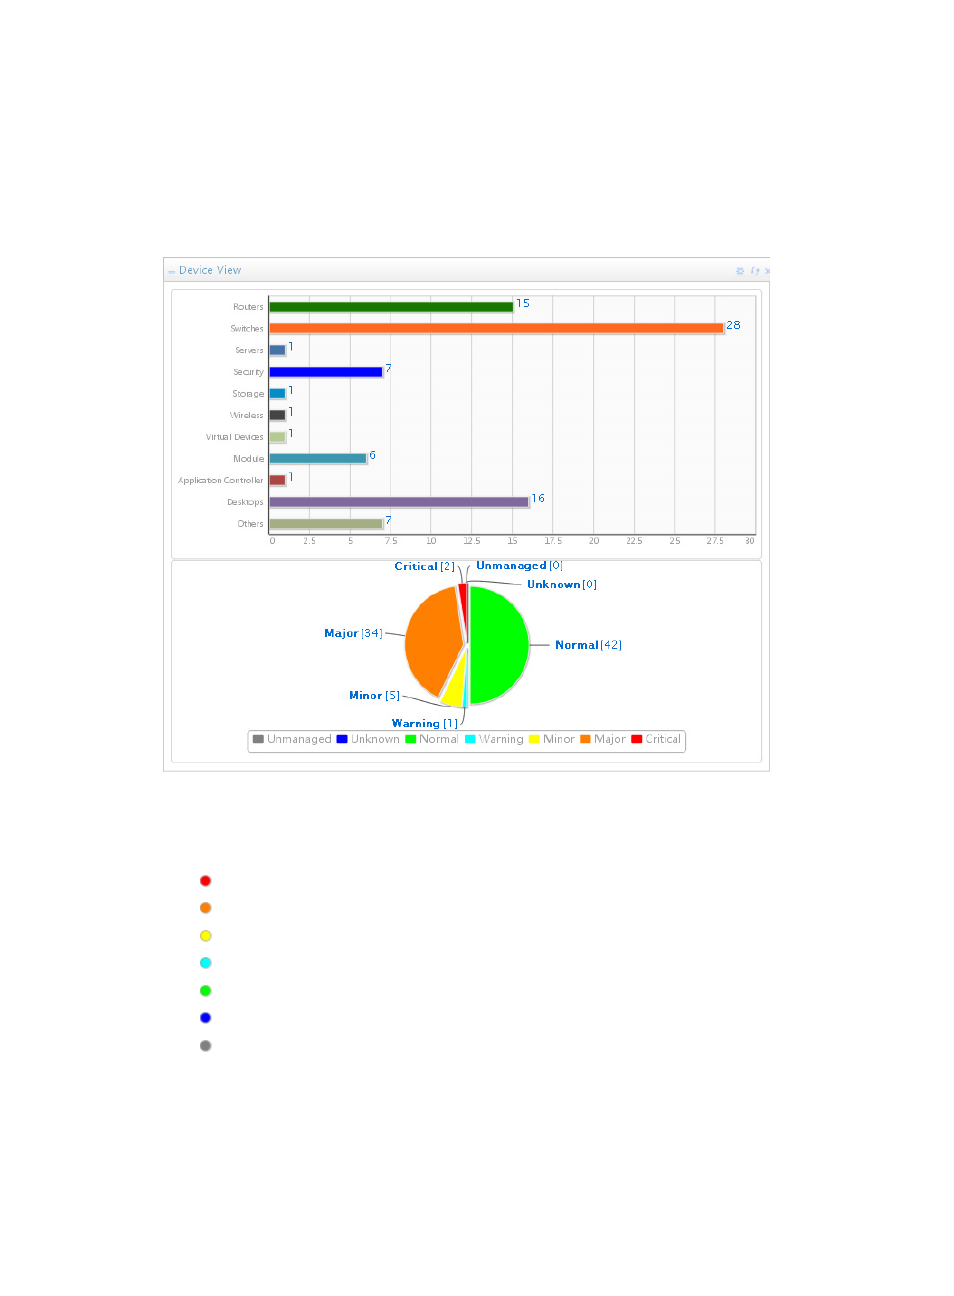
Device View
As shown in
, Device View involves two charts. The chart at the top displays the quantities of
various devices in the current system (the y-axis indicates the device type, and the x-axis indicates the
device quantity). The pie chart at the bottom displays the quantity and percentage of devices by their
alarm status.
Figure 17 Device View
The color of the icon for each custom view reflects in real time the most severe alarm or severity level of
any device within the custom view. Color-coding of the severity or alarm level conforms to industry
standards and is displayed in the list below:
•
Critical
•
Major
•
Minor
•
Warning
•
Normal
•
Informational
•
Unmanaged
By default, Device View widget is displayed on the Welcome space of the IMC home page.
IP Topology
The IP Topology widget, shown in
, displays the IP view.