Zooming into audio loudness analyzer’s data plot, Ot (see – Grass Valley iControl V.6.02 User Manual
Page 198
Logs
Zooming into Audio Loudness Analyzer’s Data Plot
188
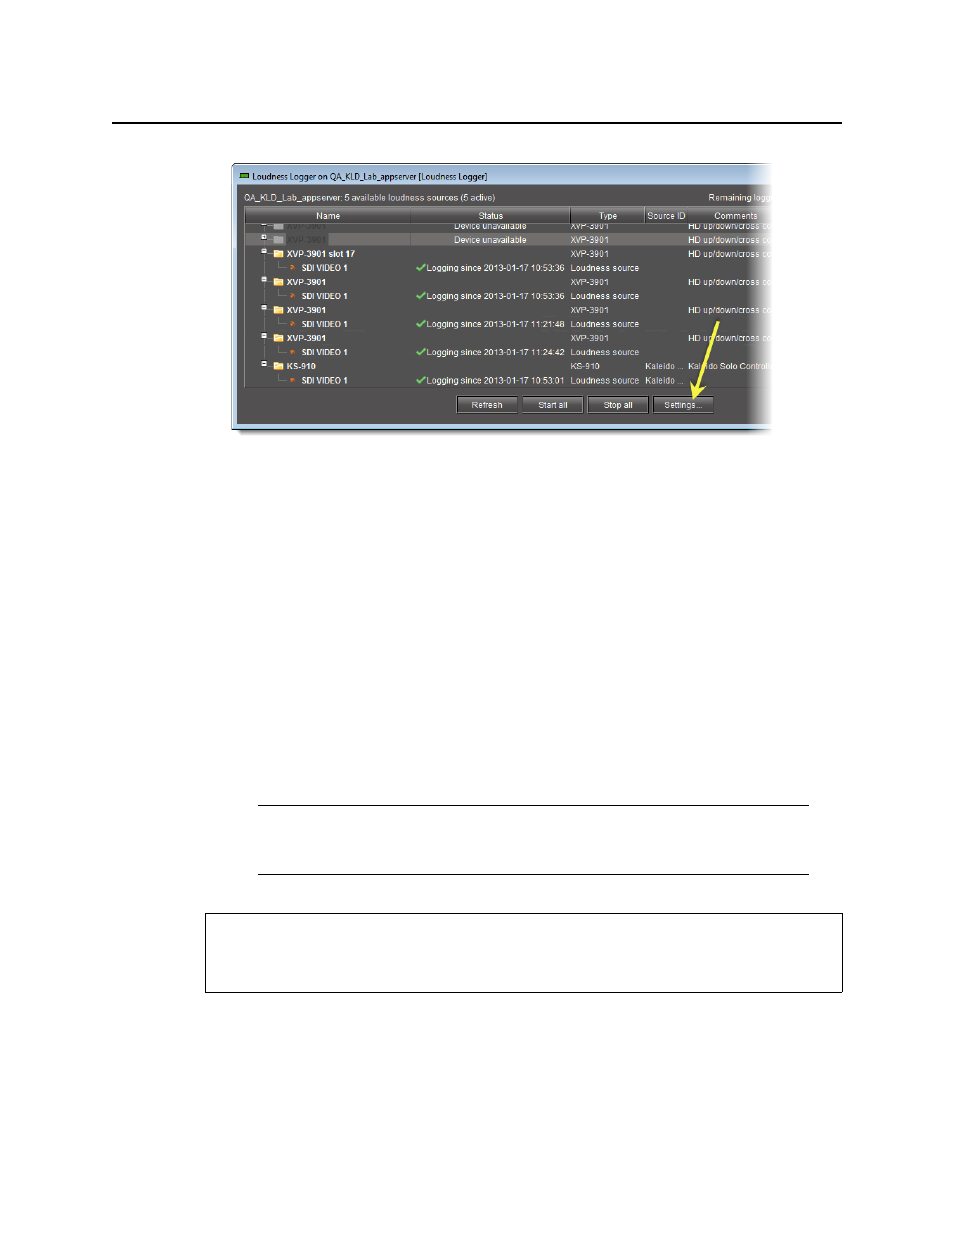
The Loudness Logger Settings window appears.
2. Click Configure.
The Loudness Logger Alarm Configuration window appears.
3. Select loudness-related alarms to be published as required, and then click OK.
The Loudness Logger Alarm Configuration window closes.
4. Close the Loudness Logger Settings window.
Zooming into Audio Loudness Analyzer’s Data Plot
After loading a loudness data file into Audio Loudness Analyzer, the plot of the loudness
data may not show, by default, the granularity of detail you might like to see at first.
Additionally, the time period covered by the data may cover too large a time span.
You can effectively zoom into the data by specifying a subset time period within the initial
graph, thereby increasing granularity and removing extraneous data.
To zoom into Audio Loudness Analyzer’s data plot
1. In Audio Loudness Analyzer, do ONE of the following two sub-procedures:
a) On the data plot, use your mouse to click and hold on any point along the vertical line
marking the desired beginning time of your zoom.
Note: You may choose to either configure analysis parameters before you zoom or
after you zoom with the same end-effect. You will lose analysis parameter data ONLY
when you click Default Analysis.
REQUIREMENT
Before beginning this procedure, make sure you have opened a loudness data file in Audio
Loudness Analyzer (see
).