HEIDENHAIN IK 5494-2D User Manual
Page 242
220
QC5200 Series User’s Guide
The contents of the Runs template can be printed, however the Reports template generally provides a more
efficient starting point for printed reports.
The contents of the Runs template can be exported in a variety of file formats as described later in this
chapter.
NOTE
If the Results window is locked using the Tools/Options/Locks functions, contents can-
not be dragged from the window to a template.
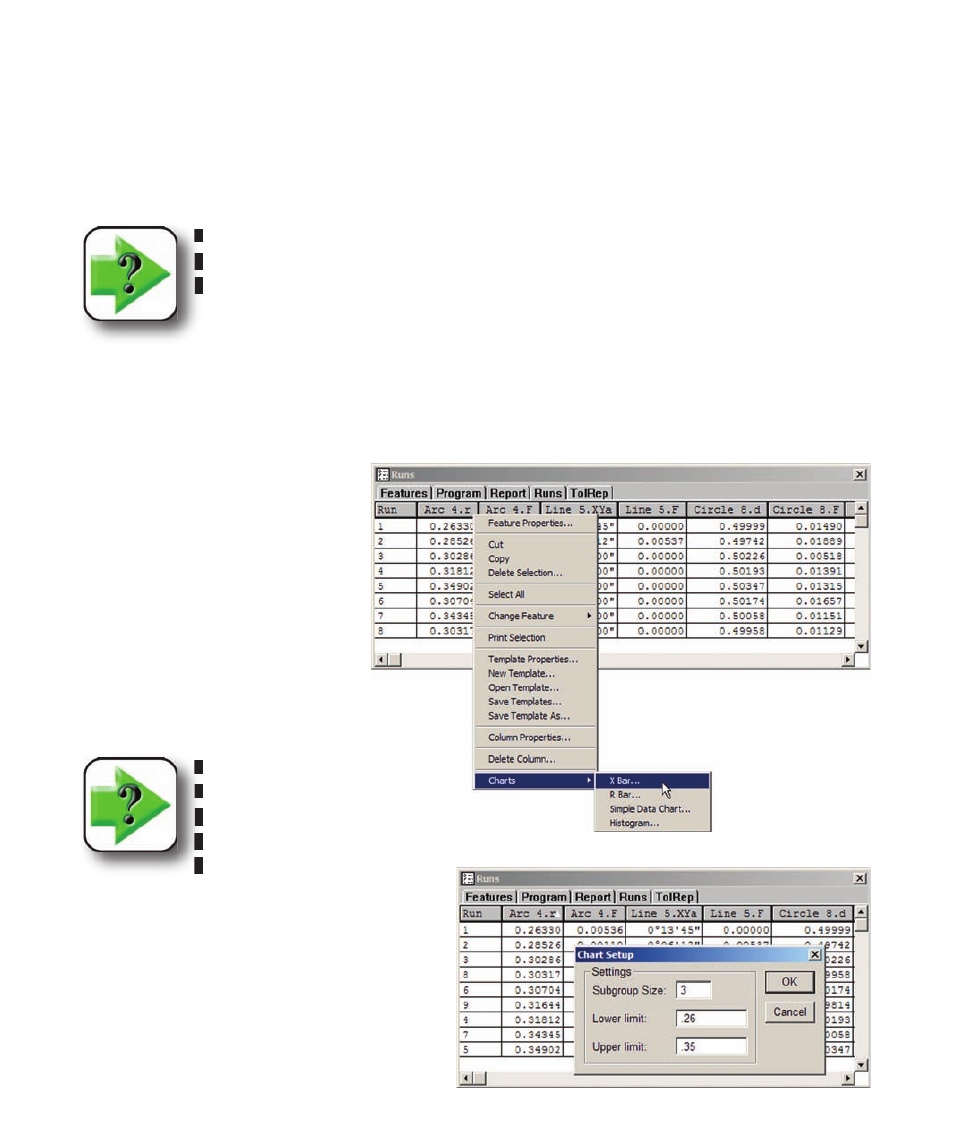
Runs charts
Each category of feature data collected by the Runs database can be charted. The chart types include X
Bar, R Bar, Simple Data and Histogram. In this example, charts will be displayed for the Arc 4 radius.
To display chart data:
1 Right-click the title of a data
column and click the desired Charts
menu item.
2 The Chart Setup dialog box will
be presented. Enter the desired sub-
group size, then evaluate the column
data to find the highest and lowest
values.
NOTE
Instructions
for
sorting data are
provided later in
this chapter.
Enter Lower and Upper Limit values slightly
higher and lower than the highest and lowest
values respectively, and then click OK.
The specified chart will be presented. The four
chart types are shown on the next page.