Image histogram results – Adept AdeptSight User Guide User Manual
Page 411
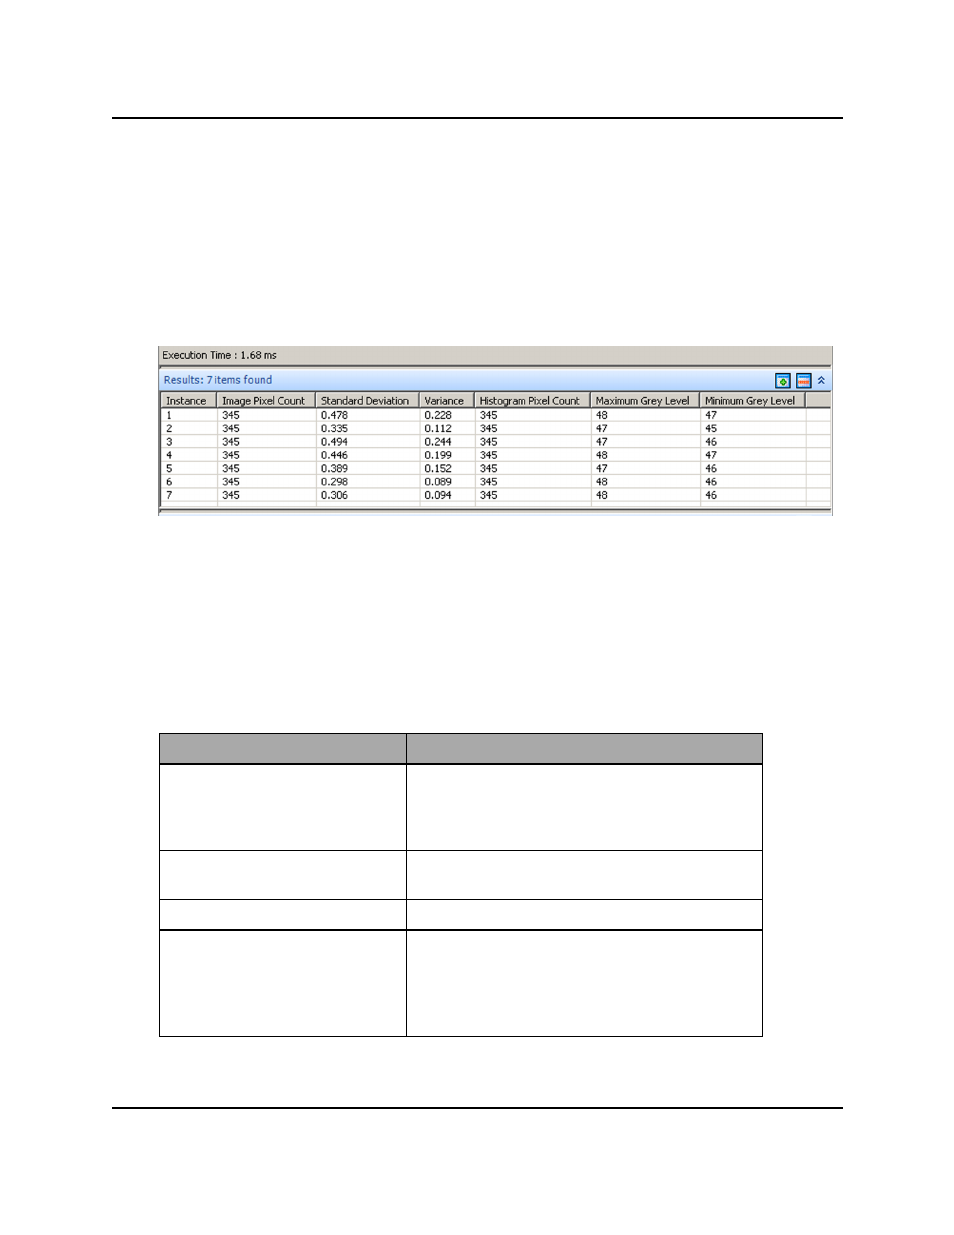
Image Histogram Results
The Image Histogram Tool outputs statistics about grey-levels for a selected region of inter-
est.
Display Window
The Display window shows the image being processed, the region of interest selected, and
the locations of found instances. The elapsed time is displayed at the bottom of this window.
Histogram Grid of Results
If there are multiple instances input, as shown, you can set the ROI to be relative to one of
them, and have the Image Histogram tool look at the same relative ROI on each instance.
Grid of Results
The grid of results presents the statistical results for the region of interest analyzed by the
Image Histogram tool.
The Image Histogram tool outputs the following results:
Object
Definition
Elapsed Time
The total execution time of the tool. Elapsed Time
is not displayed in the grid of results, but is shown
at the bottom of the Display window for each iter-
ation of the Image Histogram Tool.
Instance
Identification number of each histogram output
by the Image Histogram tool.
Frame/Group
The frame or group to which the result belongs.
Minimum Grey-Level
Lowest grey-level value of all pixels in the tool
region of interest that are included in the final his-
togram. Pixels removed from the histogram by
tails or thresholds are not included in this cal-
culation. 0 = black; 255 = white.
Image Histogram Results
AdeptSight User's Guide, Version 3.2.x, Updated: 8/23/2012
Page 411