Bar graphics – Grass Valley Kayak HD v.6.9.3 User Manual
Page 395
Advertising
Kayak — User Manual
395
Introduction
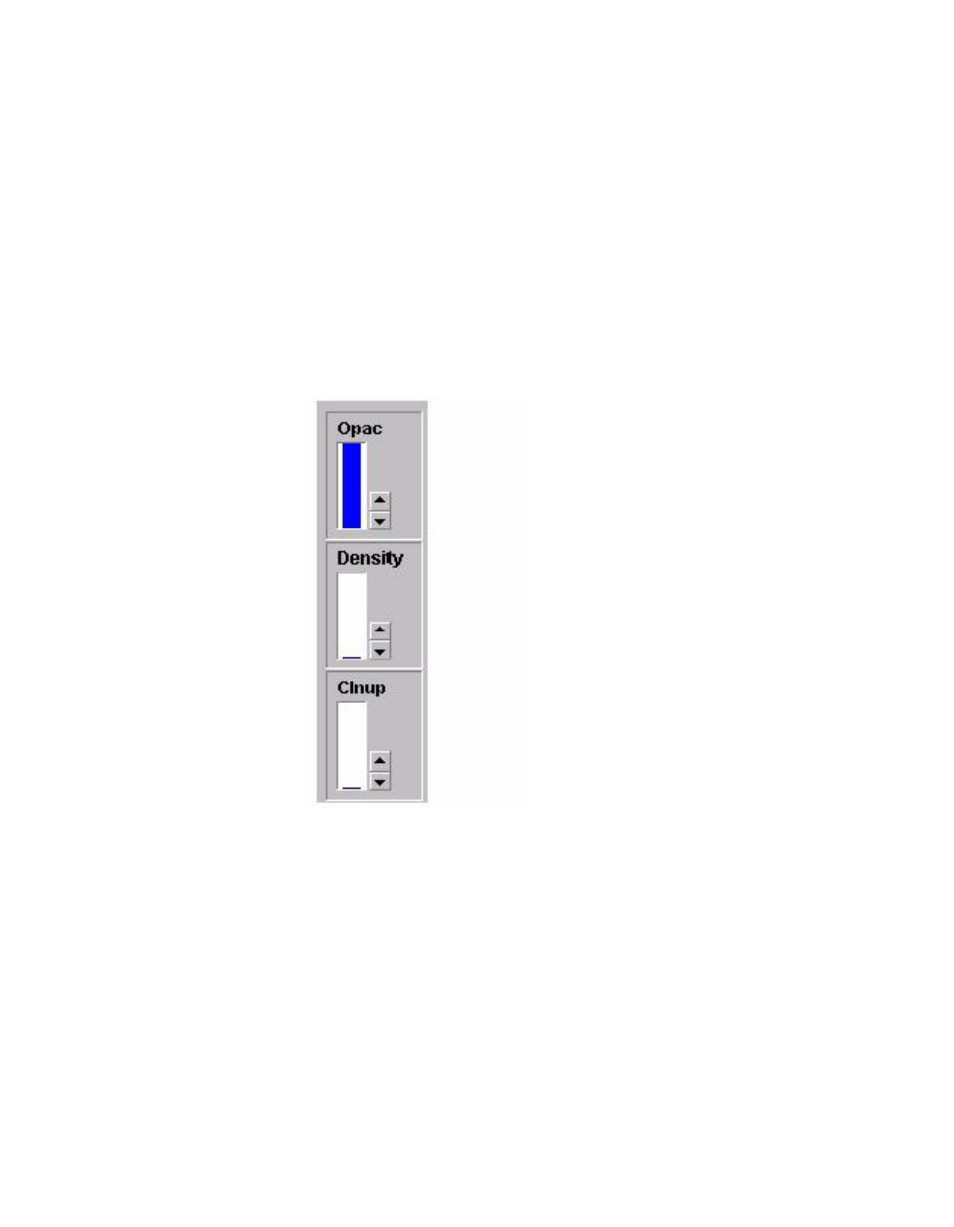
Bar Graphics
A bar graph visualizes parameters with a continuous (analog) range of
values. A bar graph is also used to adjust settings with a number of distinct
values. It is assumed that the average user associates a potentiometer and
not a switch with the setting.
A bar graph has the control state relevant/irrelevant and delegated/non-
delegated which is represented optically. A bar graph in the delegated state
is represented a blue color. An non-delegated diagram is shown in black
and an irrelevant diagram shows only the frame and the text in gray color.
The column and the numerical values are not shown.
Figure 315. Opacity Density Clnup Bar Graph
Advertising
This manual is related to the following products: