Traffic details, Application reports – H3C Technologies H3C Intelligent Management Center User Manual
Page 101
91
The Choose Interface dialog box is displayed.
2.
Select the check boxes next to the interfaces for which you want to view this report.
3.
Click OK.
The page displays the Interface Flux Trend reports for the selected interfaces.
Traffic details
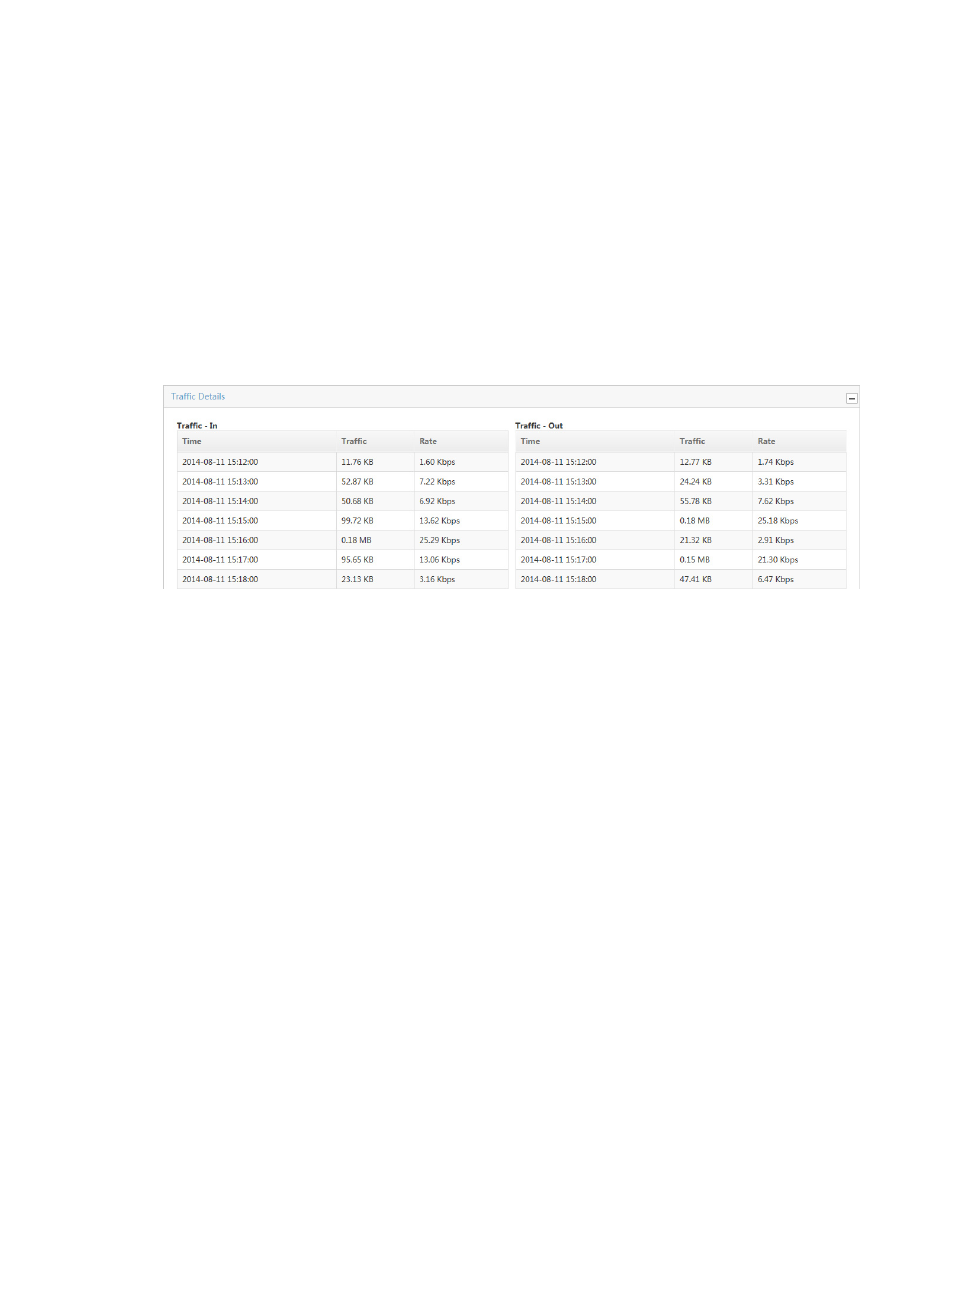
The Traffic Details list provides the data collection samples for traffic statistics based on the report time
range for the selected interface traffic analysis task or for a selected interface in a task. This report
includes timestamp, total volume of traffic, and traffic rate in seconds for both inbound and outbound
traffic.
Figure 17 Traffic Report: Traffic Details
To view this chart for an individual interface, click the bar in the Flux Distribute In Interface graph for the
interface for which you want to view this report.
For more information on the Flux Distribute In Interface report, see "
Application reports
Application reports provide traffic statistics by application, by protocol, and by application category for
all interfaces in a task or for an individual interface in a task, with information to the details for an
individual application, protocol, or application category.
Application reports for an interface traffic analysis task have the Application List, which provides a list of
applications observed for all interfaces in the selected interface traffic analysis task or for a selected
interface in a task. This list includes total volume of traffic for the associated application, rate of traffic
observed on all interfaces generated by the associated application. This report also provides capabilities
for in-depth additional reports for the selected application.
The Application Traffic Trend – In/Out stacked area chart provides average inbound/outbound traffic
rates for all applications observed for all interfaces in the selected traffic analysis task or for an individual
interface in a task.
Protocol reports for an interface traffic analysis task include the Protocol List, which provides a list of
protocols observed for all interfaces in the selected interface traffic analysis task or for a selected
interface in a task. This list includes total volume of traffic for the associated protocol, rate of traffic, and
the percentage of all observed traffic observed on all interfaces generated by the associated protocol.
This report also provides capabilities for additional in-depth reports for the selected protocol.
The Protocol Traffic Trend – In/Out stacked area chart provides average inbound/outbound traffic rates
for all protocol observed for all interfaces in the selected traffic analysis task or for a selected interface
in a task. Protocol reports also have traffic lists and trend reports for individual protocols.