Traffic trend - peak rate – H3C Technologies H3C Intelligent Management Center User Manual
Page 334
324
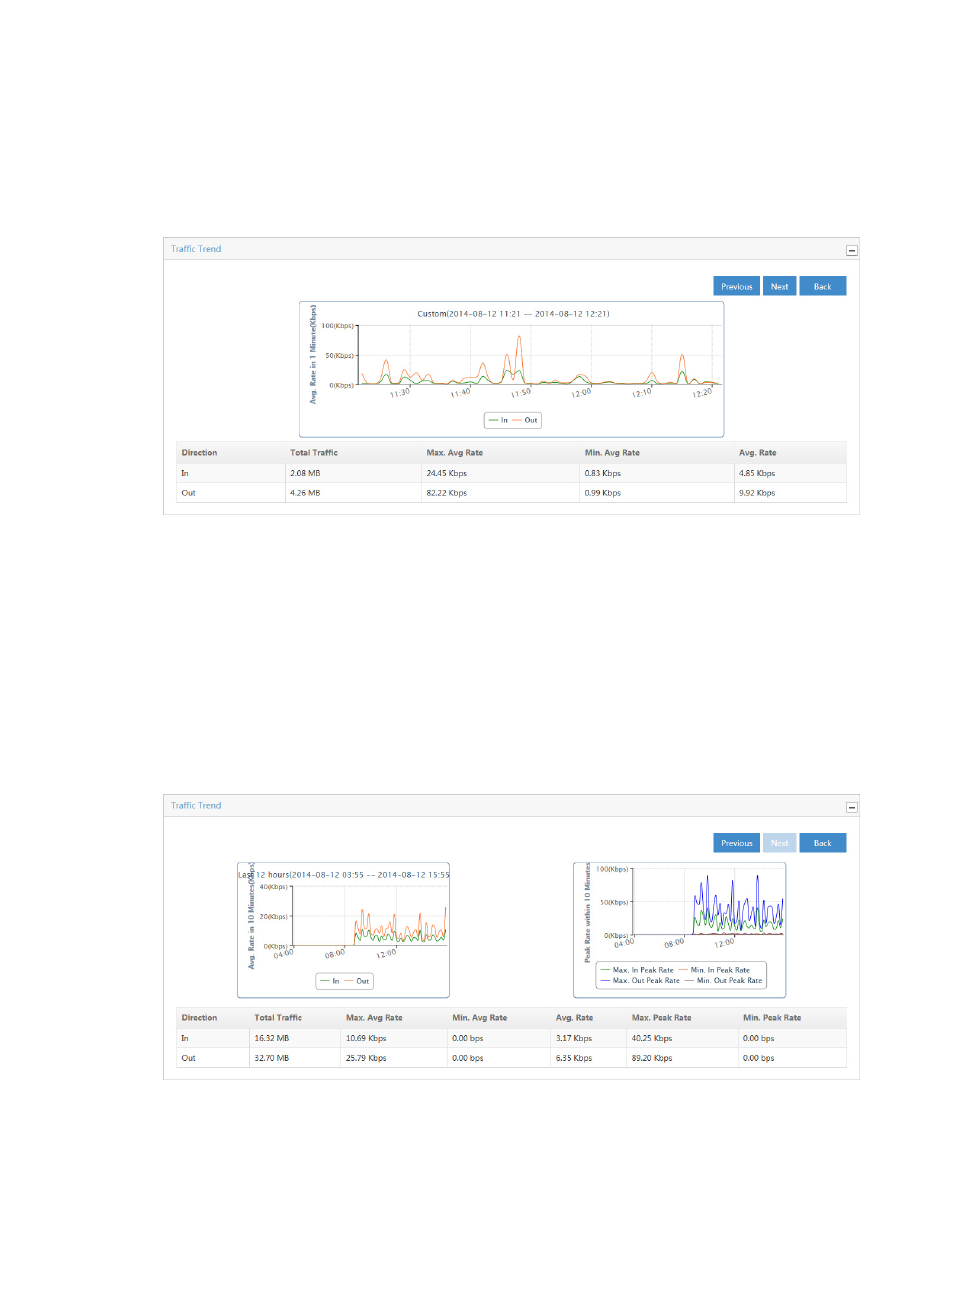
volume statistics in a tabular format for a single business in the associated task. By default, the Traffic
Trend chart displays statistics for the previous hour.
•
To view data for an earlier period, click the Previous button in the upper right corner of the chart.
•
To view data for a later period, click the Next button in the upper right corner of the chart.
Figure 220 Single Business Report: Traffic Trend Reports
To view this report for a single business traffic in a task, click the bar in the TopN Avg. Rate chart report
for the business for which you want to view reports.
Traffic trend - peak rate
NTA displays the Max./Min. Peak Rate chart to the right of the Traffic Trend chart when the Peak Traffic
Analysis feature is enabled and the time range for the report exceeds 6 hours.
The Traffic Trend – Peak Rate line chart displays the minimum and maximum peak traffic rate for the
associated task for the selected time range for both inbound and outbound traffic. This chart contains
four lines, Max. In Peak Rate, Min. In Peak Rate, Max. Out Peak Rate, and Min. Out Peak Rate.
Figure 221 Single Business Report: Peak Rate
To view this report for a single business traffic in a task, click the bar in the TopN Avg. Rate chart report
for the business for which you want to view reports, and set the time range for the report to a value longer
than 6 hours.