Summary list (last 1 hour) – H3C Technologies H3C Intelligent Management Center User Manual
Page 93
83
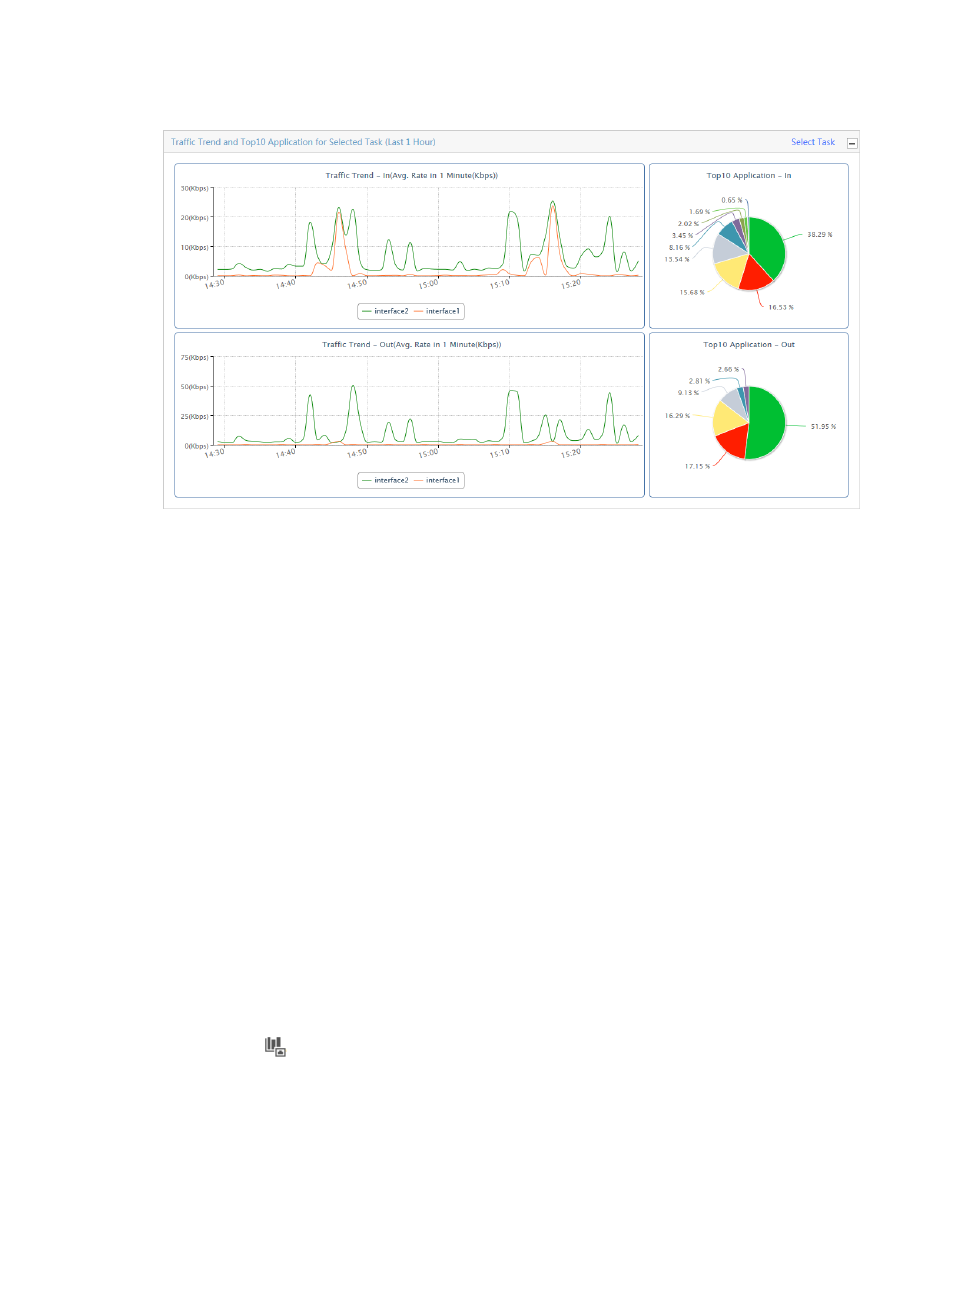
Figure 7 Summary Report: Traffic Trend and TopN Application for Selected Task
The Traffic Trend – In line chart provides the summarized average rate of inbound traffic for all interfaces
in the selected interface traffic analysis task for the last hour.
The Traffic Trend – Out line chart provides the summarized average rate of outbound traffic for all
interfaces in the selected interface traffic analysis task for the last hour.
The TopN Application – In pie chart displays the distribution of inbound traffic for the TopN applications
for all Interfaces in the selected traffic analysis task for the last hour.
The TopN Applications – Out pie chart displays the distribution of outbound traffic for the TopN
applications for all interfaces in the selected traffic analysis task for the last hour.
No data is graphed on these charts until you specify a task.
1.
To select the task, click the Select Task link in the upper right corner of the Traffic Trend and TopN
Application for Selected Task title bar.
The Choose NTA Task dialog box appears.
2.
Select the check box next to the interface task for which you want to view this report.
3.
Click OK.
The page displays the Traffic Trend – In, Traffic Trend – Out, TopN Application – In, and TopN
Application – Out reports for the selected task.
Summary list (last 1 hour)
The Summary List provides inbound and outbound traffic rates and percentage of traffic statistics
summarized by interface task for the last hour.
1.
Click the
Interface Traffic Analysis Task entry of the left navigation tree.
Summary list contents
•
Task Name—Contains the name of the interface traffic analysis task. The contents of this field
link to reports for associated task.
•
In Rate—Provides the inbound traffic rate for all interfaces configured for the associated task.