Topn traffic list for tos/mpls exp – H3C Technologies H3C Intelligent Management Center User Manual
Page 98
88
chart. For more information about configuring the Baseline Analysis feature for the interface traffic
analysis task, see "
Adding an interface traffic analysis task
Figure 11 Traffic Report: Peak Rate with baseline
To view these charts for an individual interface, click the bar in the Flux Distribute In Interface graph for
the interface you want to view this report for. For more information on the Flux Distribute In Interface
report, see "
."
By default, the Traffic Trend chart displays statistics for the previous hour.
•
To view data for an earlier period, click the Previous button located in the upper right corner of the
Traffic Trend chart.
•
To view data for a later period, click the Next button located in the upper right corner of the Traffic
Trend chart.
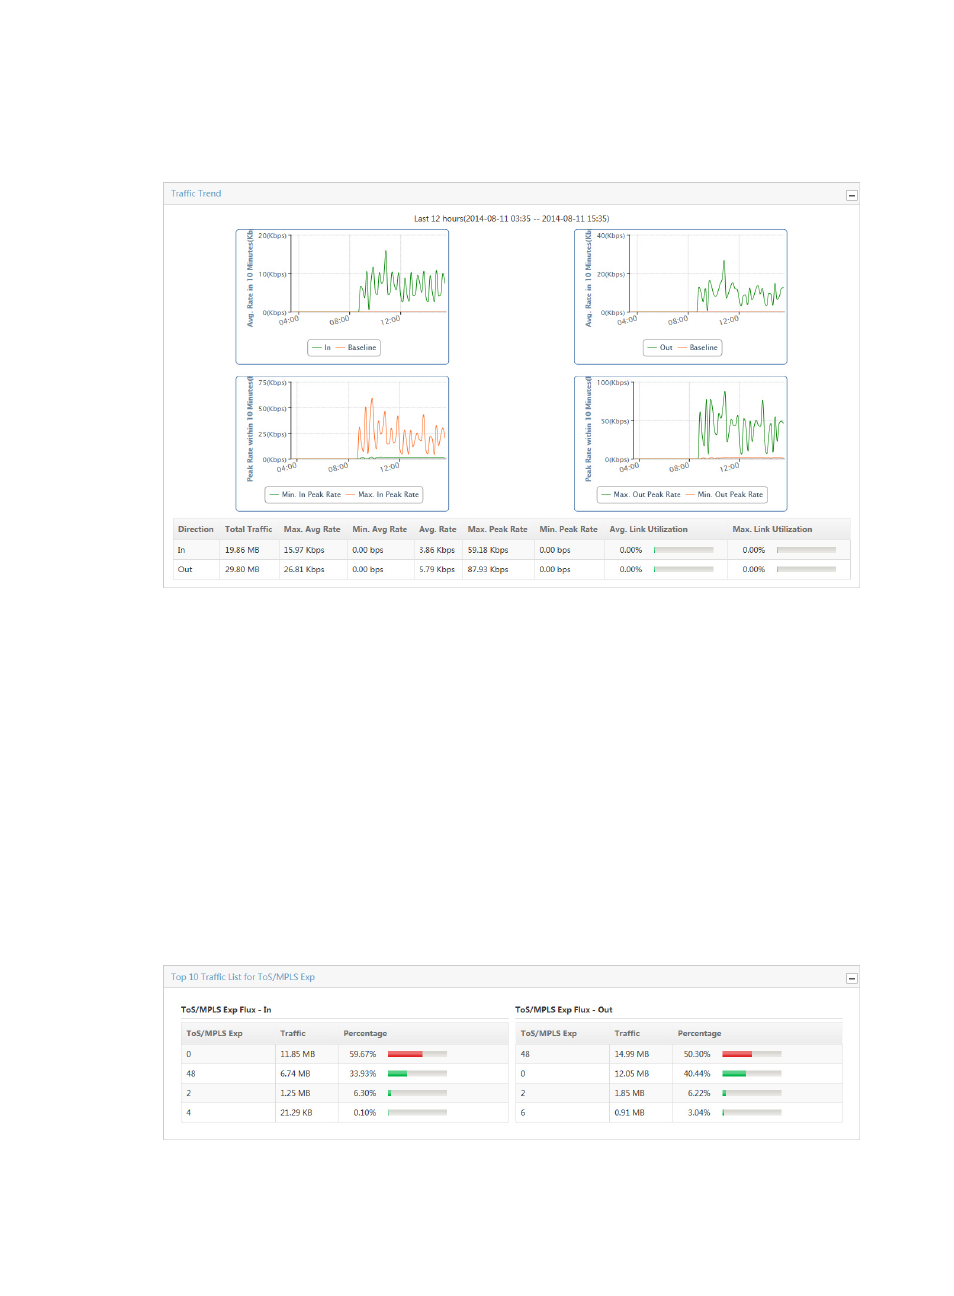
TopN traffic list for ToS/MPLS Exp
The TopN Traffic List for ToS/MPLS Exp provides administrators with a tabular view of total traffic volume
and percentage of total traffic volume grouped by ToS or MPLS Exp for both inbound and outbound
traffic for the selected time range for an interface traffic analysis task or for a selected interface in a task.
Figure 12 Traffic Report: TopN Traffic List for ToS/MPLS Exp