Summary list (last 1 hour) – H3C Technologies H3C Intelligent Management Center User Manual
Page 174
164
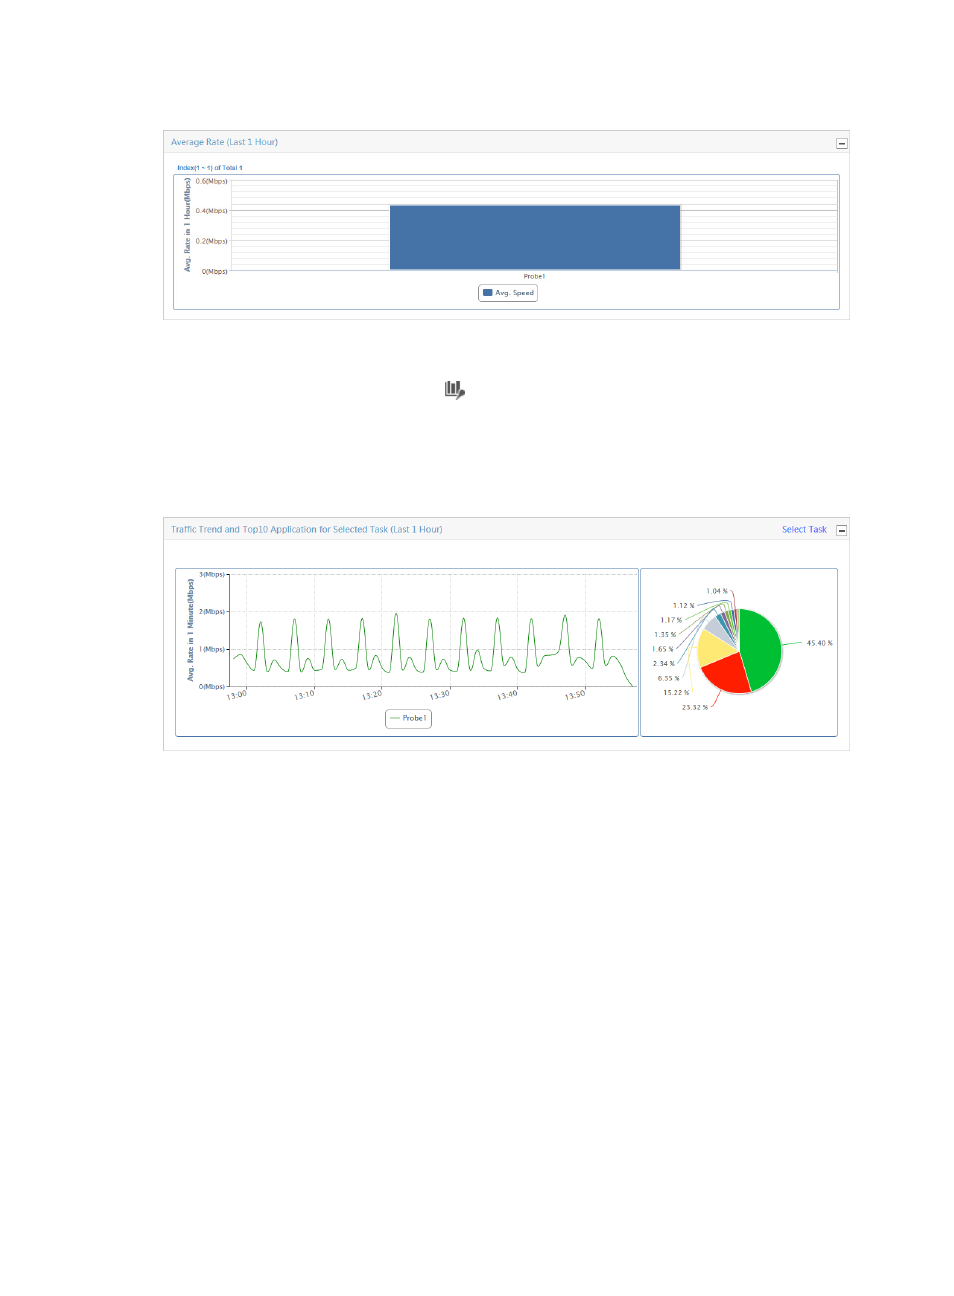
Figure 90 Summary Report: Average Rate (Last 1 Hour)
Traffic trend and TopN application for selected task (last 1 hour)
You can access this graph by clicking the
Probe Traffic Analysis Task entry of the left navigation tree.
The Traffic Trend for Selected Task line chart displays the average traffic rate per second for the selected
probe task. The TopN Application for Selected Task pie chart displays the distribution of traffic for the
selected probe task. These charts are located in the middle of the page.
Figure 91 Summary Report: TopN Application by Selected Task
By default, this chart contains no data. To populate this chart with data, you must first select a probe task.
1.
To select a task, click the Select Task link located in the upper right corner of the Traffic Trend and
TopN Application for Selected Task title bar.
2.
The Choose NTA Task dialog box is displayed. Click the box next to the probe task you want to
view this report for.
3.
Click OK.
The page displays the Traffic Trend and TopN Application for Selected Task reports for the selected task.
Summary list (last 1 hour)
The Summary List provides the total volume of traffic and traffic rates summarized by probe task for the
last hour.
Summary list contents
•
Task Name—Name of the probe traffic analysis task.
The contents of this field link to reports for associated tasks.
•
Traffic—Total volume of traffic in the last hour for the associated probe.
•
Rate—Rate of traffic in the last hour for the associated probe.