Traffic trend - average, Traffic trend - peak rate – H3C Technologies H3C Intelligent Management Center User Manual
Page 219
209
c.
To export the data, click Export.
d.
To export this report, click the export icon
on the toolbar.
e.
From the File Format list, select the export file format. Options are:
•
Crystal Reports (RPT)
•
•
Microsoft Excel (97-2003)
•
Microsoft Excel (97-2003) Data–Only
•
Microsoft Word (97-2003) – Editable
•
Rich Text Format (RTF)
•
Comma Separated Values (CSV)
f.
From Page Range, select the page range.
g.
Click Export.
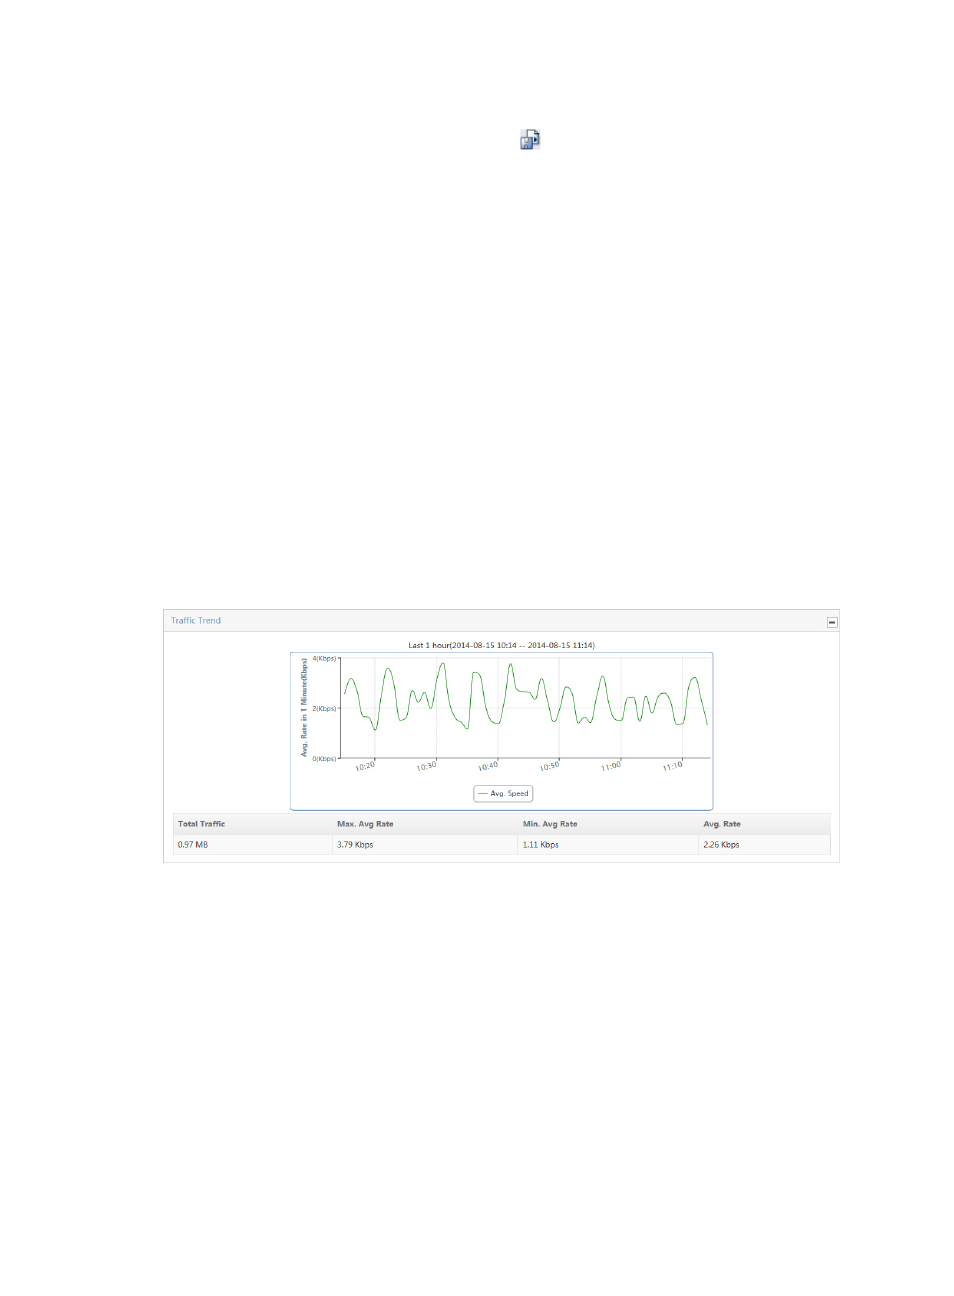
Traffic trend - average
The Traffic Trend line chart displays the average per second traffic rate for all applications in the selected
traffic analysis task. This chart also provides average, minimum average, maximum average, and total
traffic volume statistics in a tabular format for all applications in the associated task. If there is more than
one application for the selected task, these statistics reflect traffic for all applications configured in a task.
Figure 127 Traffic Report: Traffic Trend Report
Trend chart displays statistics for the previous hour.
1.
To view data for an earlier period, click the Previous button located in the upper right corner of the
Traffic Trend chart.
2.
To view data for a later period, click the Next button located in the upper right corner of the Traffic
Trend chart.
Traffic trend - peak rate
NTA displays the Max./Min. Peak Rate chart to the right of the Traffic Trend chart when the Peak Traffic
Analysis feature is enabled and the time range for the report exceeds 6 hours.
The Traffic Trend – Peak Rate line chart displays the minimum and maximum peak traffic rate for the
associated task for the selected time range. This chart contains two lines. The red line displays the
maximum peak rate. The green line displays the minimum peak rate.