Topn traffic report for source host, Topn traffic list for source host – H3C Technologies H3C Intelligent Management Center User Manual
Page 222
212
•
•
Microsoft Excel (97-2003)
•
Microsoft Excel (97-2003) Data–Only
•
Microsoft Word (97-2003) – Editable
•
Rich Text Format (RTF)
•
Comma Separated Values (CSV)
f.
From Page Range, select the page range.
g.
Click Export.
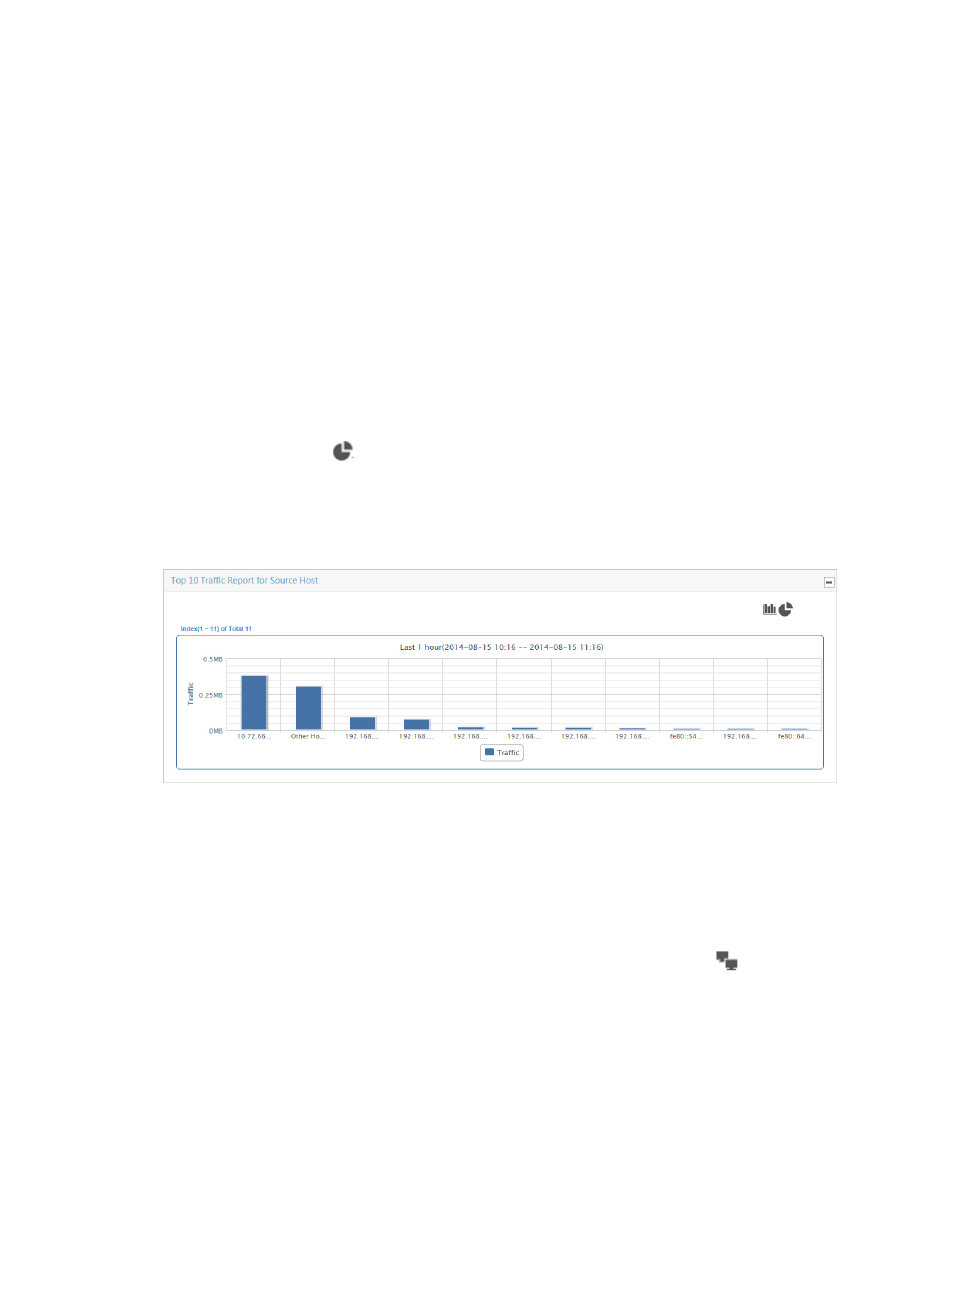
TopN traffic report for source host
The TopN Traffic Report for Source Host bar chart displays the TopN source hosts with the most
inbound/outbound application traffic in a certain period of time in a selected application traffic analysis
task. Click a bar in the chart to view the traffic analysis report of each source host.
Click the pie chart icon
to change the bar chart to a pie chart. The pie chart displays the traffic
distribution of the TopN source hosts for all applications in the selected traffic analysis task for the
selected time range. Each slice of the pie chart is a link for navigating to traffic reports for the selected
host.
Figure 130 Source Report: TopN Traffic Report for Source Host
TopN traffic list for source host
The TopN Traffic List for Source Host provides a list of the TopN source hosts measured by volume of
traffic observed for all applications in the selected application traffic analysis task for the selected time
range. This list includes the source host IP address, total volume of traffic for the associated source host
and the percentage of all observed traffic generated by the source host.
The IP address is a link to reports for the selected source host. The host query icon
next to the Source
IP address is a link for initiating a host query and a link to the results of the host query.