Traffic trend – peak rate – H3C Technologies H3C Intelligent Management Center User Manual
Page 97
87
Figure 9 Traffic Report: Traffic Trend with baseline
To view these charts for a specific interface, click the bar in the Flux Distribute In Interface graph for the
interface you want to view this report for. For more information on the Flux Distribute In Interface report,
see "
By default, the Traffic Trend chart displays statistics for the previous hour.
•
To view data for an earlier period, click the Previous button located in the upper right corner of the
Traffic Trend chart.
•
To view data for a later period, click the Next button located in the upper right corner of the Traffic
Trend chart.
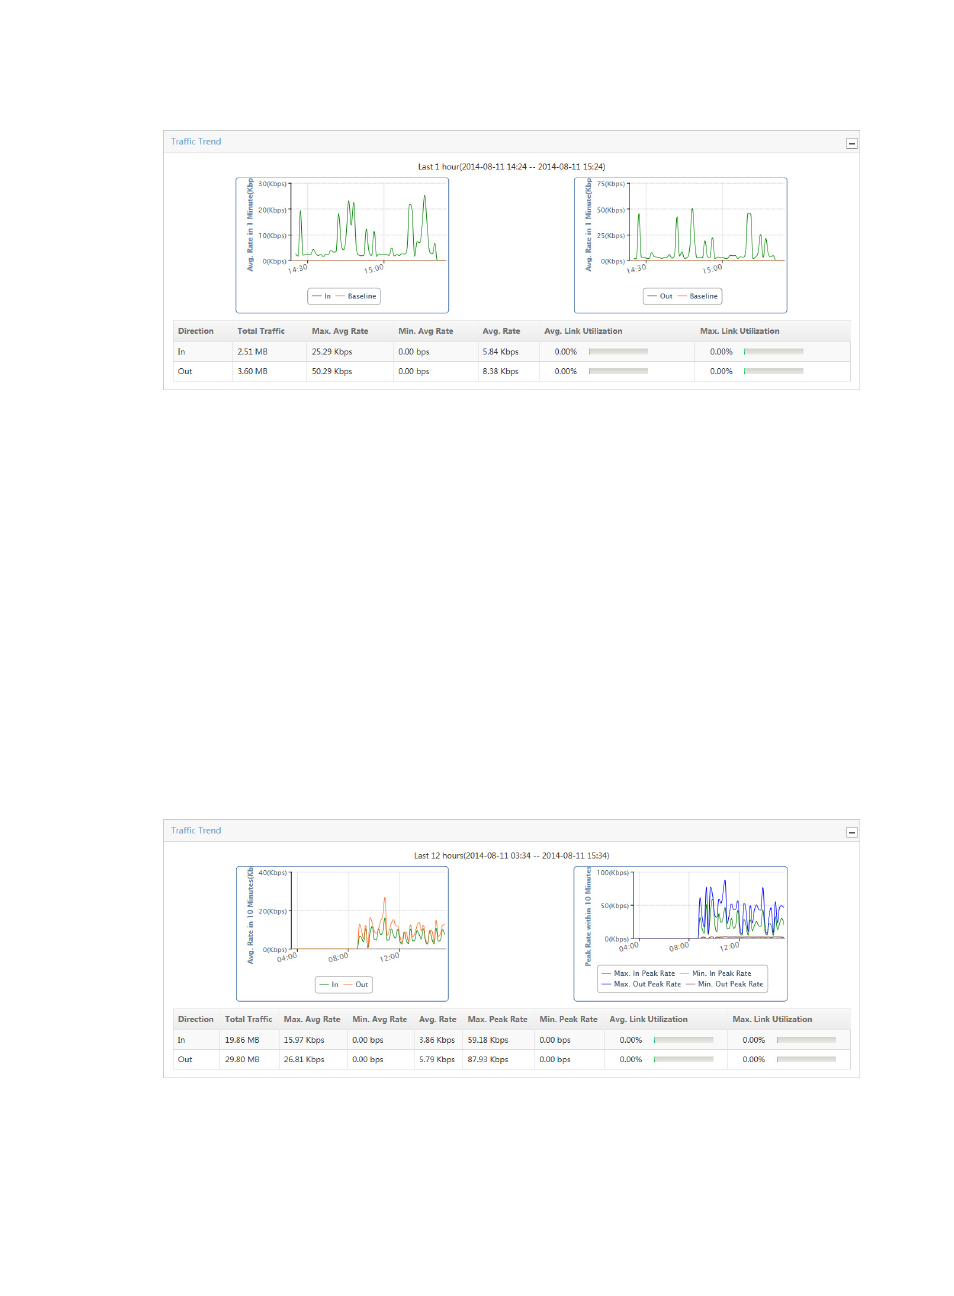
Traffic trend – peak rate
NTA displays the Max./Min. Peak Rate chart to the right of the Traffic Trend chart when the Peak Traffic
Analysis feature is enabled and the time range for the report exceeds 6 hours.
The Traffic Trend – Peak Rate line chart displays the minimum and maximum peak traffic rate for the
associated task for the selected time range for both inbound and outbound traffic. This chart contains
four lines: Max. In Peak Rate, Min. In Peak Rate, Max. Out Peak Rate, and Min. Out Peak Rate.
Figure 10 Traffic Report: Peak Rate
If the Baseline Analysis feature is enabled for the selected traffic analysis task, the Traffic Trend
combination line chart shows two charts: inbound Traffic Trend and outbound Traffic Trend. NTA
displays the Max./Min. In Peak Rate chart and Max./Min. Out Peak Rate chart under the Traffic Trend