Average rate (last 1 hour), Summary list (last 1 hour) – H3C Technologies H3C Intelligent Management Center User Manual
Page 331
321
Navigating to the inter-business traffic analysis reports
1.
Select Service > Traffic Analysis and Audit > Settings from the top navigation bar.
2.
To view summary reporting for all inter-business traffic analysis tasks, click the
Inter-Business
Traffic entry under the Traffic Analysis and Audit area of the left navigation tree.
3.
To view the report for a single task, move your mouse pointer to the shortcut menu icon to the
right of
Inter-Business Traffic Analysis Task. The Inter-Business Traffic Analysis Task shortcut
menu appears to display all inter-business traffic analysis tasks created in NTA. Click the name link
for a task to view the inter-business traffic analysis report of the task.
Summary reports for all inter-business traffic analysis tasks
Summary reports provide the highest level of reporting for all tasks of the same type. You access the
reports by clicking the
Inter-Business Traffic entry of the left navigation tree under the Traffic
Analysis and Audit area. The reports provide navigation aids to the reports for a specific task. The
following information describes the summary reports and their features.
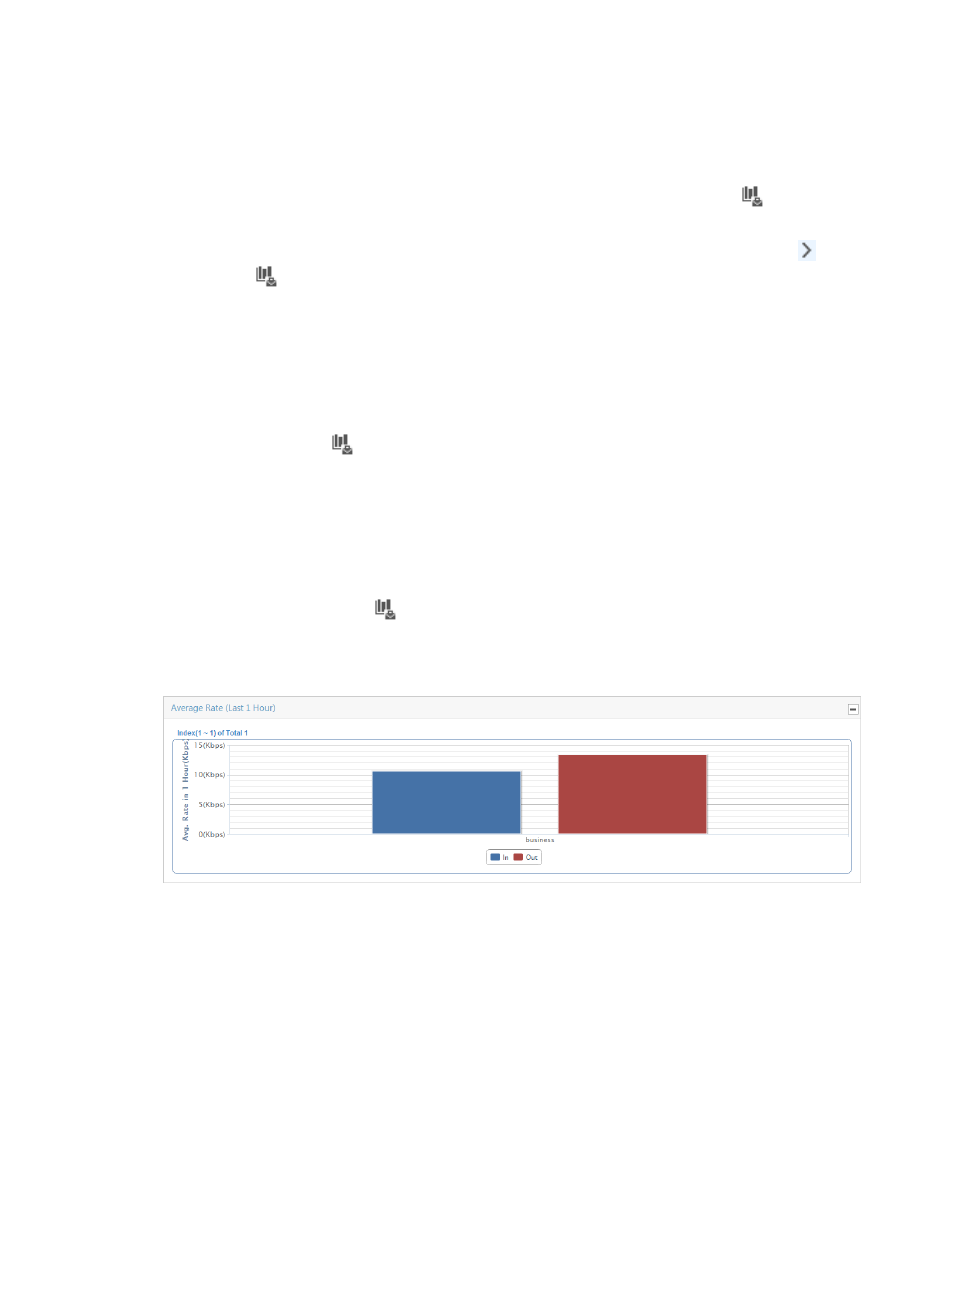
Average rate (last 1 hour)
This bar graph summarizes traffic rates for all host and application groups in every inter-business traffic
analysis task, grouped by inter-business traffic analysis task.
To access this graph, click the
Inter-Business Traffic entry of the left navigation tree.
The bars in the graph are links to the reports for the selected task.
Figure 217 Summary Report: Average Rate (Last 1 Hour)
Summary list (last 1 hour)
The Summary List provides traffic statistics summarized by inter-business task.
Summary List contents
•
Task Name—This field contains the name of the inter-business traffic analysis task. Click the
contents of this field to navigate to reports for the associated task.
•
Total Rate—This field provides the total rate of traffic observed for all applications configured for the
associated inter-business task for the last hour.
•
In Rate—This metric provides the rate traffic for all inbound traffic for the host and application
groups configured for the associated task for the last hour.
•
Out Rate—This metric provides the rate traffic for all outbound traffic for the host and application
groups configured for the associated task for the last hour.