Topn avg. rate, Traffic details, Traffic trend - average – H3C Technologies H3C Intelligent Management Center User Manual
Page 333
323
•
End Time—Enter the end time of the time range, in the format of YYYY-MM-DD hh:mm. Or,
click the Calendar icon
to the right of the input box to manually specify an end
time.
b.
Click OK.
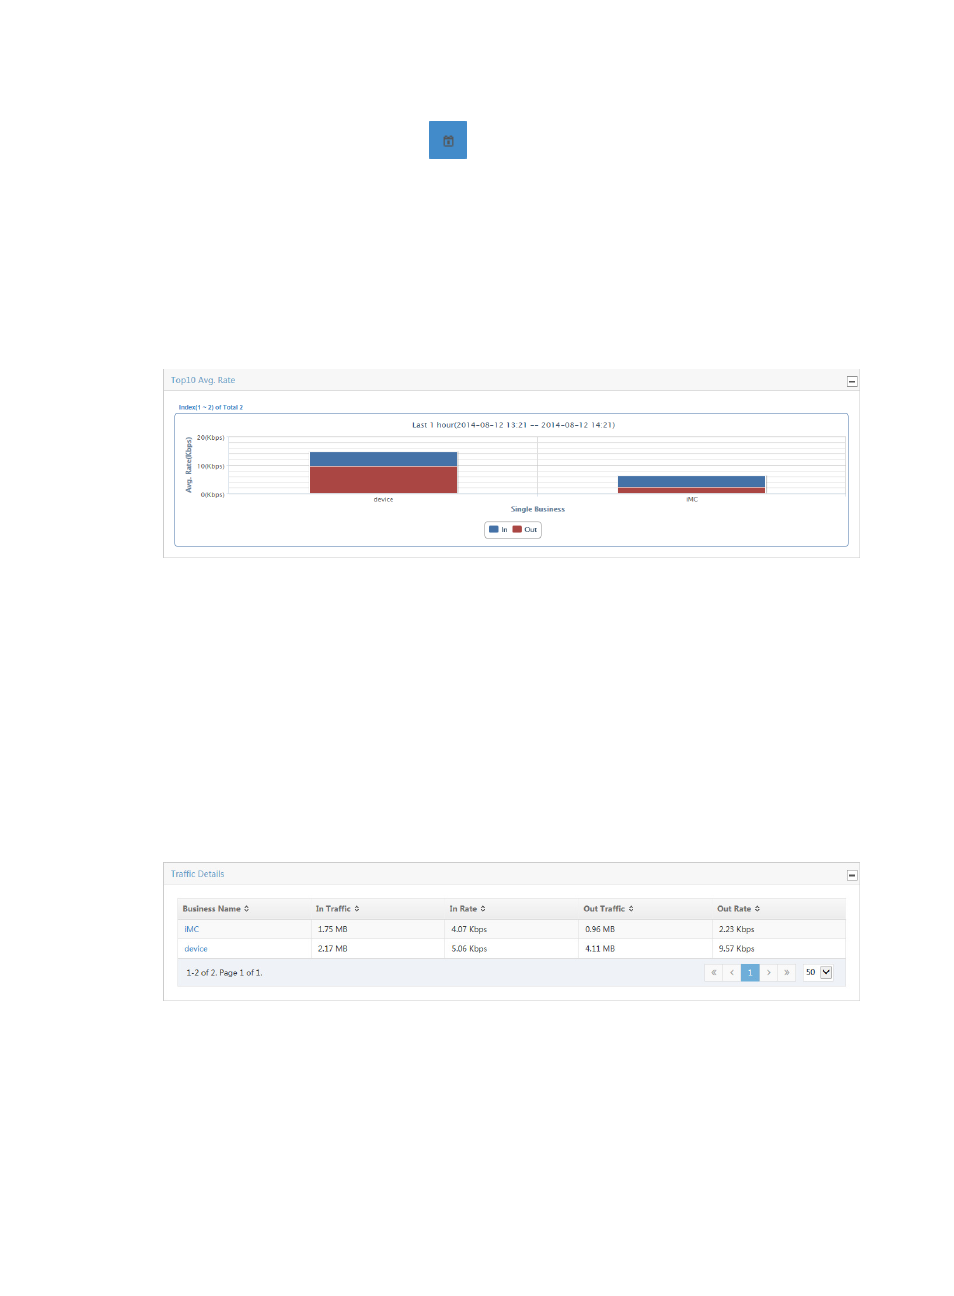
TopN avg. rate
The TopN Avg. Rate stacked bar chart provides average per second inbound and outbound traffic rate
summarized by all host and application groups in the selected traffic analysis task. The bars in the graph
serve as a link for navigating to more granular reports for the selected single business.
Figure 218 Single Business Report: TopN Avg. Rate Report
By default, the TopN Avg. Rate stacked bar chart displays statistics for the previous hour.
•
To view data for an earlier period, click the Previous button located in the upper right corner of the
chart.
•
To view data for a later period, click the Next button located in the upper right corner of the chart.
Traffic details
The Traffic Details list provides you with a summary of traffic statistics for all host and application groups
in the task based on the report time range. This list includes total volume of inbound and outbound traffic
and traffic rate in seconds for both inbound and outbound traffic for the selected time range. The
business name is a link for navigating to reports for a single host and application group.
Figure 219 Single Business Report: Traffic Details List
Select 8, 15, 50, 100, or 200 from the lower right side of the main pane to configure how many items per
page you want to view.
Traffic trend - average
The Traffic Trend chart provides you with the average rate of traffic for the single business in the
associated task. This chart also provides average, minimum average, maximum average, and total traffic