Session host traffic trend report – H3C Technologies H3C Intelligent Management Center User Manual
Page 277
267
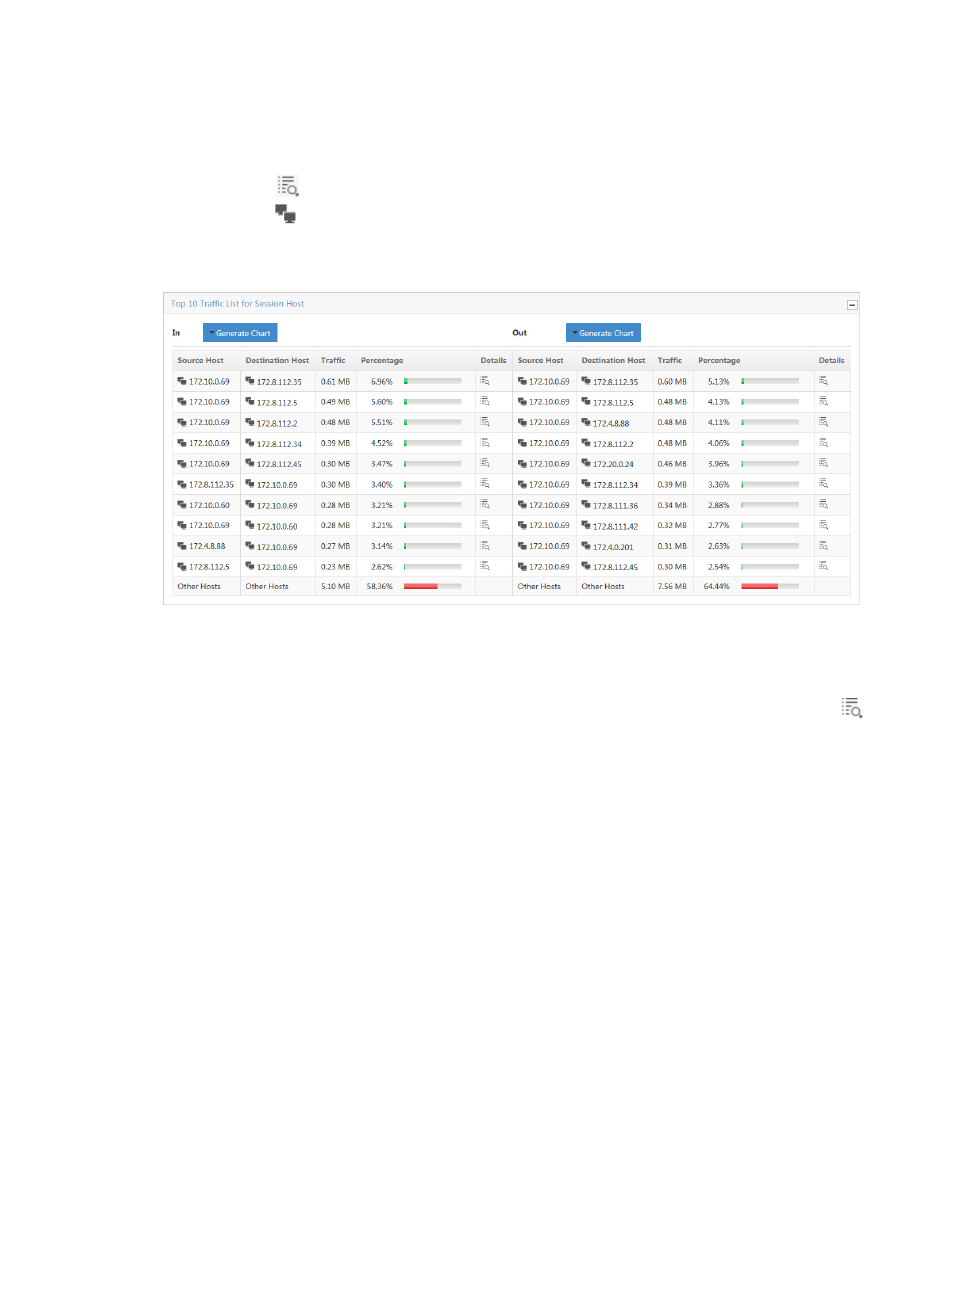
analysis task for the selected time range. This list includes the source and destination host IP addresses,
total volume of traffic generated by the source and destination session pair, and the percentage of all
observed traffic generated between the source and destination session pair.
The Details icon
is a link for viewing reports for the selected session or source/destination pair. The
host query icon
next to the Source Host and Destination Host IP address fields is a link for initiating
a host query and a link to the results of the host query.
Figure 176 Destination Report: TopN Traffic Report for Session Host - In/Out
Session host traffic trend report
To view this report for a host traffic analysis task, click the slice of the pie chart on the TopN Traffic Report
for Session Host report for the session pair you want to view statistics for. Or, click the Details icon
on the TopN Traffic List for Session Host.
The Session Host Traffic Trend Report line chart provides the average rate of traffic for the source and
destination host pair. By default, the Session Host Traffic Trend Report chart displays statistics for the
previous hour.
•
In the upper right corner of the chart, click the Previous button to view data for an earlier period.
•
In the upper right corner of the chart, click the Next button to view data for a later period.
•
Click Back to return to the main Session report page.