Topn traffic report for source host, Topn traffic list for source host – H3C Technologies H3C Intelligent Management Center User Manual
Page 118
108
c.
To export the data, click Export.
d.
To export this report, click the export icon
on the toolbar.
e.
From the File Format list, select the export file format. Options are:
•
Crystal Reports (RPT)
•
•
Microsoft Excel (97-2003)
•
Microsoft Excel (97-2003) Data–Only
•
Microsoft Word (97-2003) – Editable
•
Rich Text Format (RTF)
•
Comma Separated Values (CSV)
f.
From Page Range, select the page range.
g.
Click Export.
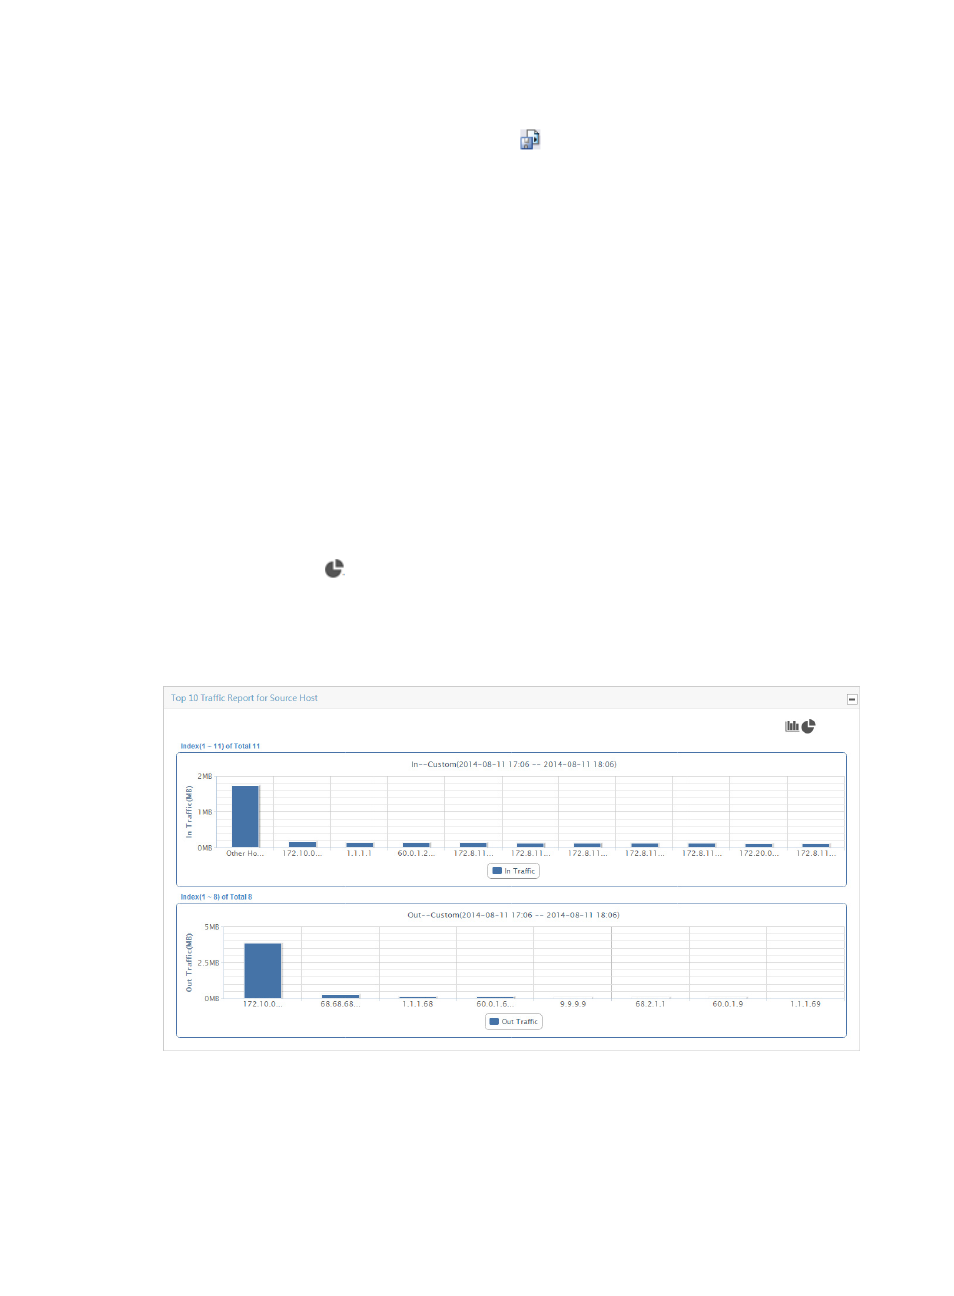
TopN traffic report for source host
The TopN Traffic Report for Source Host – In/Out bar chart displays the TopN source hosts with the most
inbound/outbound traffic on all interfaces in a certain period of time in a selected interface traffic
analysis task. Click a bar in the bar chart to view the traffic analysis report of each source host.
Click the pie chart icon
to change the bar chart to a pie chart. The pie chart displays the distribution
of inbound/outbound traffic of the TopN source hosts on all interfaces in the selected traffic analysis task
or on an interface in a task for the selected time range. The slices of the pie chart link to traffic reports for
the selected host.
Figure 34 Source Report: TopN Traffic Report for Source Host - In/Out
TopN traffic list for source host
The TopN Traffic List for Source Host – In/Out provides a list of the TopN source hosts measured by
volume of inbound/outbound traffic observed on all interfaces in the selected interface traffic analysis
task or for an interface in a task for the selected time range. This list has the source interface IP address,