Vlan traffic distribution – H3C Technologies H3C Intelligent Management Center User Manual
Page 139
129
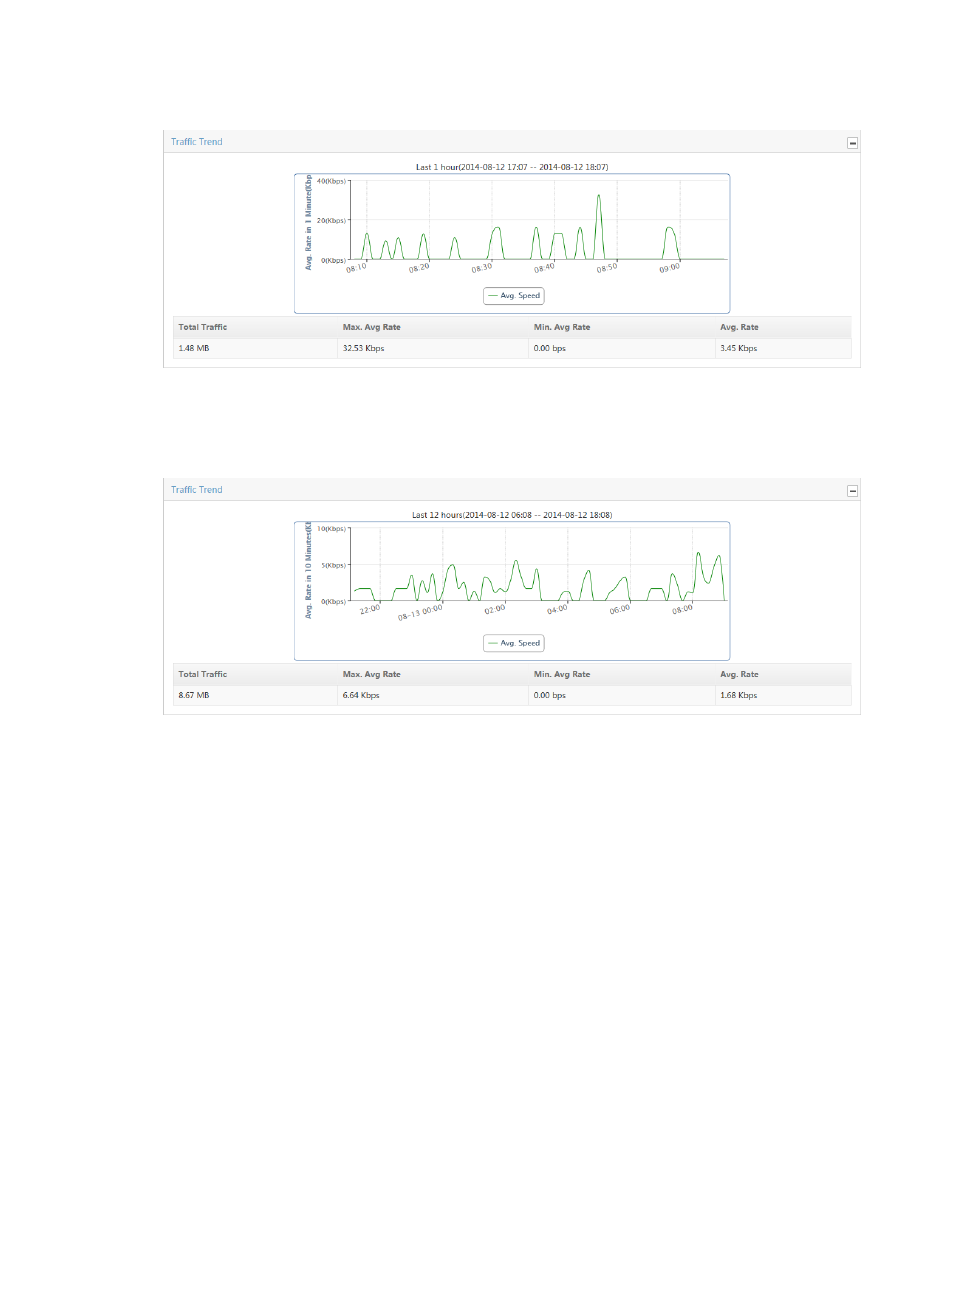
Figure 49 Traffic Report: Traffic Trend
The Peak Rate line chart displays the minimum and maximum peak traffic rate for inbound or outbound
traffic for the associated task during the selected time range.
Figure 50 Traffic Report: Peak Rate
To view these charts for an individual VLAN, click a VLAN bar in the Flux Distribute In VLAN graph. For
more information on the Flux Distribute In VLAN report, see "
."
By default, the Traffic Trend chart displays statistics for the previous hour.
•
To view data for an earlier period, click the Previous button in the upper right corner of the Traffic
Trend chart.
•
To view data for a later period, click the Next button in the upper right corner of the Traffic Trend
chart.
VLAN traffic distribution
If the task you selected has multiple VLANs configured for it, the VLAN Traffic Distribution bar chart is
displayed. This bar chart displays the average rate of inbound or outbound traffic for every VLAN
configured in the task for the selected time range. The bars in the graph link to the reports for the selected
VLAN.