Traffic trend – average – H3C Technologies H3C Intelligent Management Center User Manual
Page 291
281
g.
Click Export.
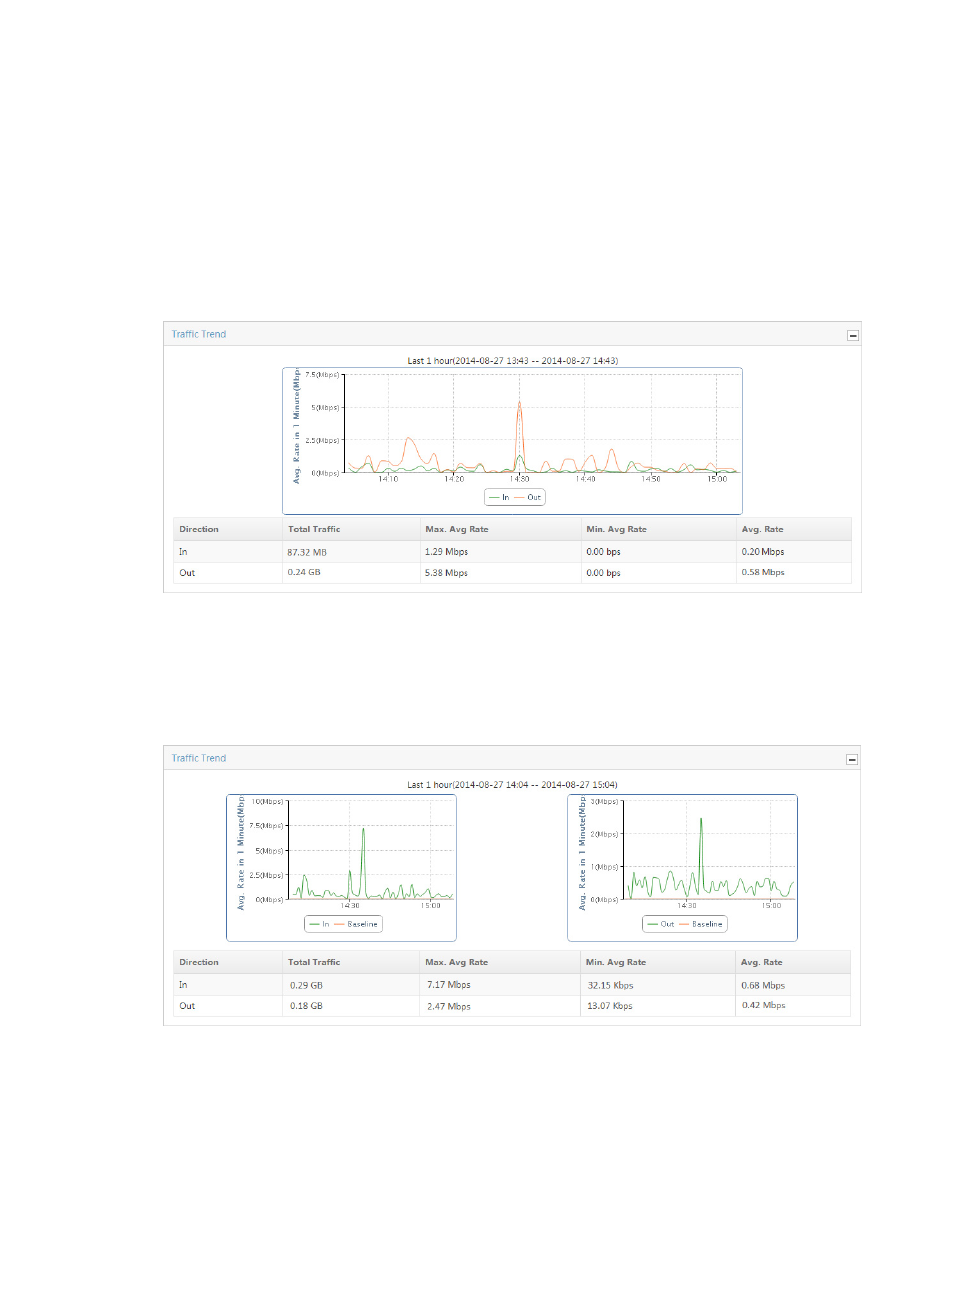
Traffic trend – average
The Traffic Trend combination chart provides average rate statistics for both inbound and outbound
traffic for all VPNs in the selected traffic analysis task. This chart also provides average, minimum
average, maximum average, and total traffic volume statistics in a tabular format for both inbound and
outbound traffic for all VPNs in the associated task for the selected time range. If there is more than one
VPN for the selected task, these statistics will reflect traffic for all VPNs configured in a task.
Figure 183 Traffic Report: Traffic Trend Report
If the selected traffic analysis task enabled the Baseline Analysis feature, the Traffic Trend combination
line chart shows two charts: inbound Traffic Trend and outbound Traffic Trend. The green line is the
baseline and the red area is the average traffic rate. For more information on configuring the Baseline
Analysis feature for the VPN traffic analysis task, see "
Adding a VPN traffic analysis task
Figure 184 Traffic Report: Traffic Trend Report
By default, the Traffic Trend chart displays statistics for the previous hour.
1.
To view data for an earlier period, click the Previous button located in the upper right corner of the
Traffic Trend chart.
2.
To view data for a later period, click the Next button located in the upper right corner of the Traffic
Trend chart.