Summary list (last 1 hour) – H3C Technologies H3C Intelligent Management Center User Manual
Page 136
126
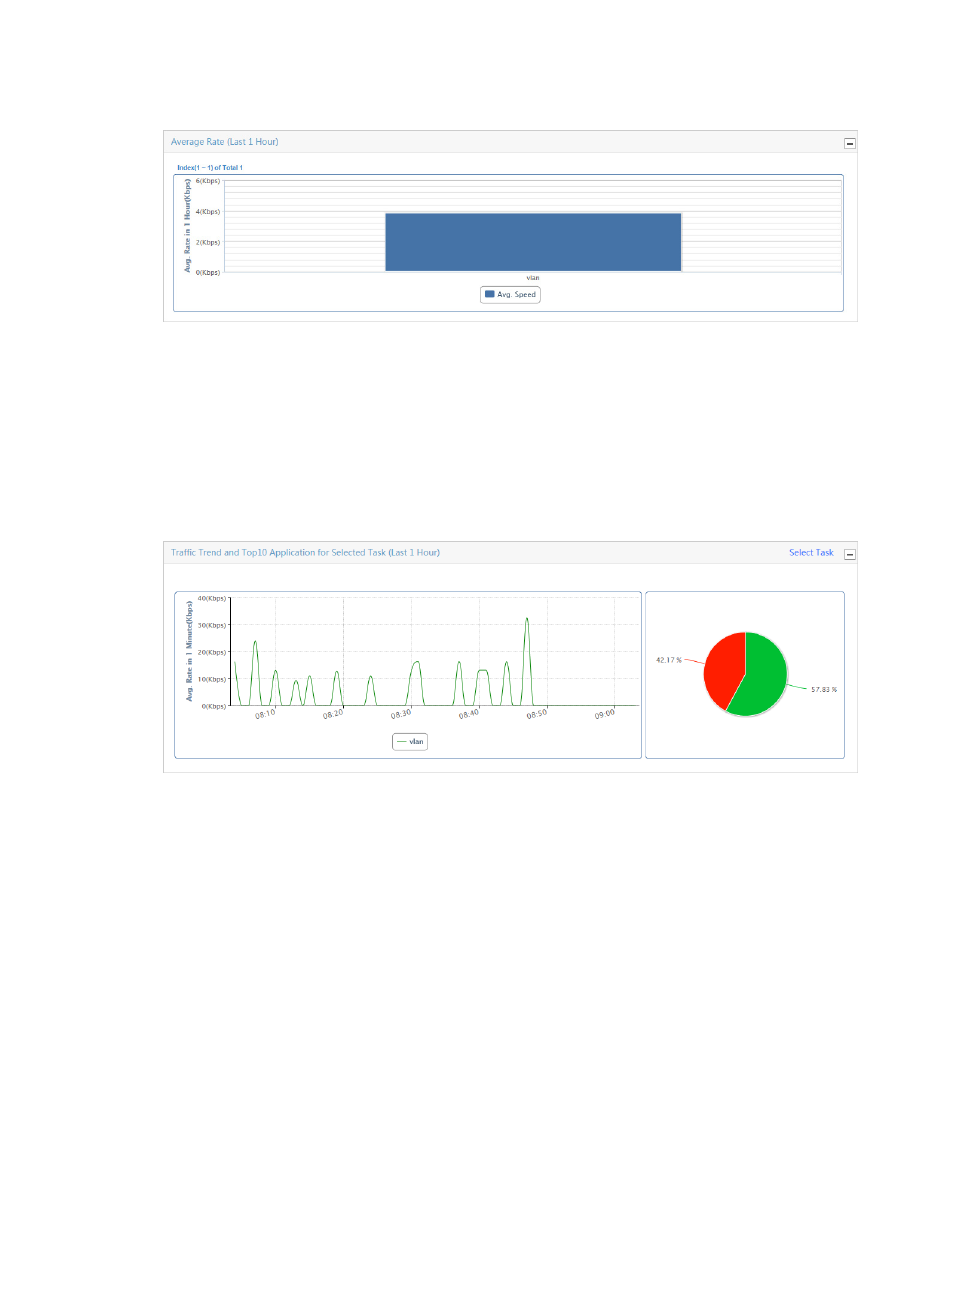
Figure 46 Summary Report: Average Rate (Last 1 Hour)
Traffic trend and TopN application for selected task (last 1 hour)
The Traffic Trend line chart and the TopN Application for selected task pie chart:
•
The Traffic Trend line chart summarizes the average rate of inbound or outbound traffic for all
VLANs in the selected VLAN traffic analysis tasks during the last hour.
•
The TopN Application pie chart displays the distribution of inbound or outbound traffic for the TopN
applications for all VLANs in the selected VLAN traffic analysis task during the last hour.
Figure 47 Summary Report: Traffic trend and TopN application for selected task (last 1 hour)
No data is graphed on these charts until you specify a task.
1.
To select the task, click the Select Task link in the upper right corner of the Traffic Trend and TopN
Application for Selected Task title bar.
The Choose NTA Task dialog box is displayed.
2.
Select the check boxes next to the VLAN traffic analysis tasks you want to view in this report.
3.
Click OK. The page displays the Traffic Trend and TopN Application reports for the selected VLAN
task.
Summary list (last 1 hour)
The Summary List (last 1 hour) displays inbound and outbound VLAN traffic volume and the rate of each
VLAN traffic analysis task during the last hour.