Summary reports for all application tasks, Average rate (last 1 hour), Traffic trend for selected task (last 1 hour) – H3C Technologies H3C Intelligent Management Center User Manual
Page 216
206
To view the Application Traffic Analysis Task shortcut menu, move your mouse pointer to the shortcut
menu icon to the right of
Application Traffic Analysis Task. The shortcut menu displays all
application traffic analysis tasks created in NTA. Click the name link for a task to view the application
traffic analysis report of the task.
The following information describes the reporting options available for application traffic analysis tasks.
It also describes the process for navigating to application traffic analysis tasks, the summary reports
available for application tasks, and the reports and features available for a traffic analysis task.
Navigating to the application traffic analysis reports
1.
Select Service > Traffic Analysis and Audit > Settings.
2.
Under the Traffic Analysis and Audit area of the left navigation tree, click the
Application
Traffic Analysis Task entry under the Traffic Analysis and Audit area of the left navigation tree.
3.
To view the report for a single task, move your mouse pointer to the shortcut menu icon to the
right of
Application Traffic Analysis Task.
The Application Traffic Analysis Task menu appears to display all application traffic analysis tasks
created in NTA. Click the name link for a task to view the application traffic analysis report of the
task.
Summary reports for all application tasks
Summarized reports are the highest level of reporting for all tasks of the same type. These reports are
accessed by clicking the
Application Traffic Analysis Task entry of the left navigation tree under the
Traffic Analysis and Audit area. In addition, these reports provide navigation aids to the reports for an
individual task. The following information describes the summarized reports and their features.
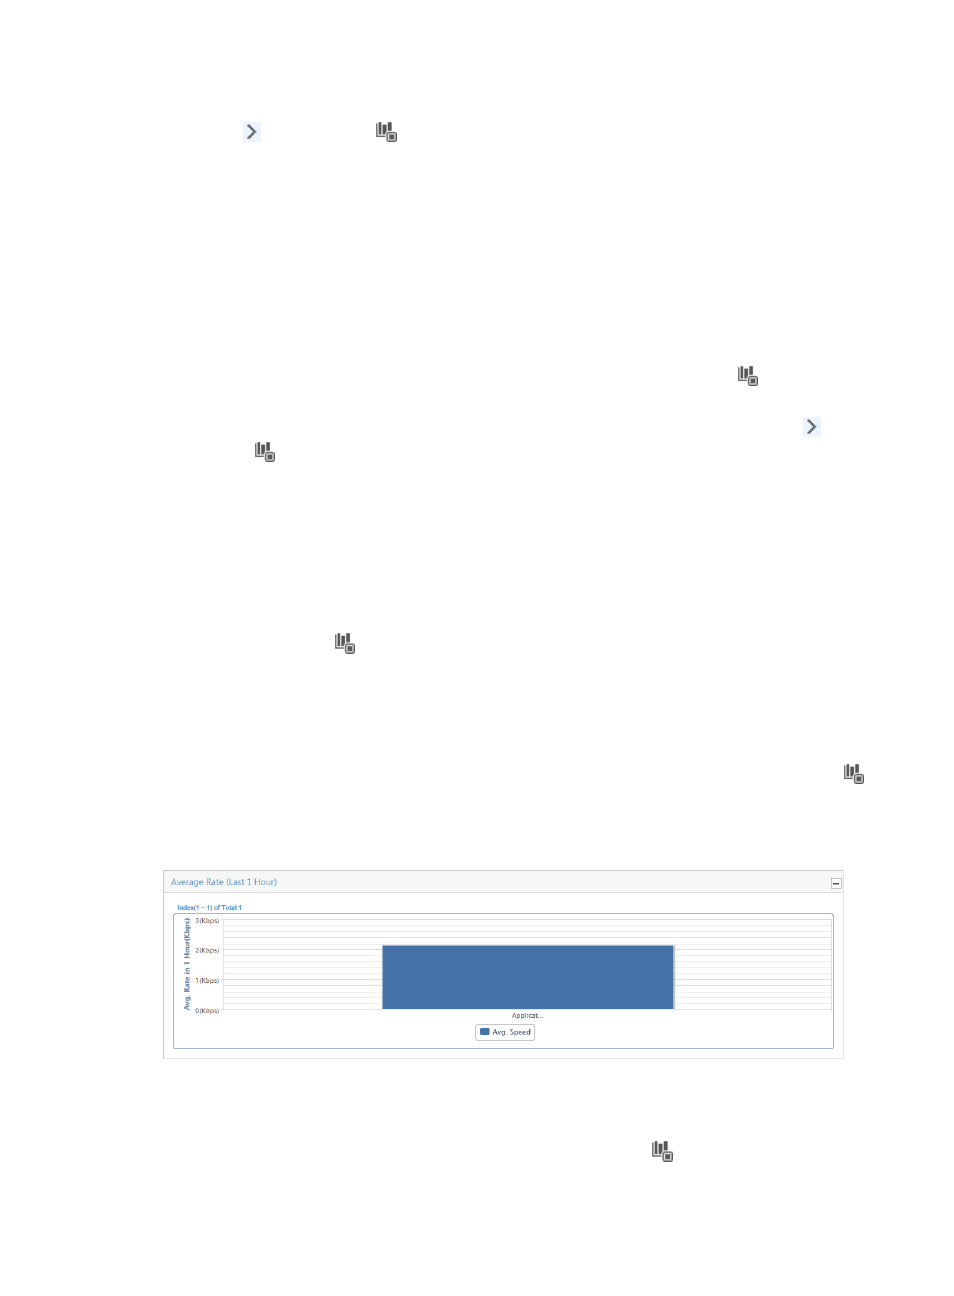
Average rate (last 1 hour)
The Average Rate bar graph summarizes traffic rates for all applications in every application traffic
analysis task, grouped by application traffic analysis task. You can access this graph by clicking the
Application Traffic Analysis Task entry of the left navigation tree. The bars in the graph link to the reports
for the selected task.
Figure 125 Summary Report: Application Task Average Rate (Last 1 Hour)
Traffic trend for selected task (last 1 hour)
The Traffic Trend for Selected Task line chart provides traffic trend rates for the selected application traffic
analysis tasks for the last hour. You can access this chart by clicking the
Application Traffic Analysis
Task entry of the left navigation tree.