Session reports, Query sessions – H3C Technologies H3C Intelligent Management Center User Manual
Page 163
153
•
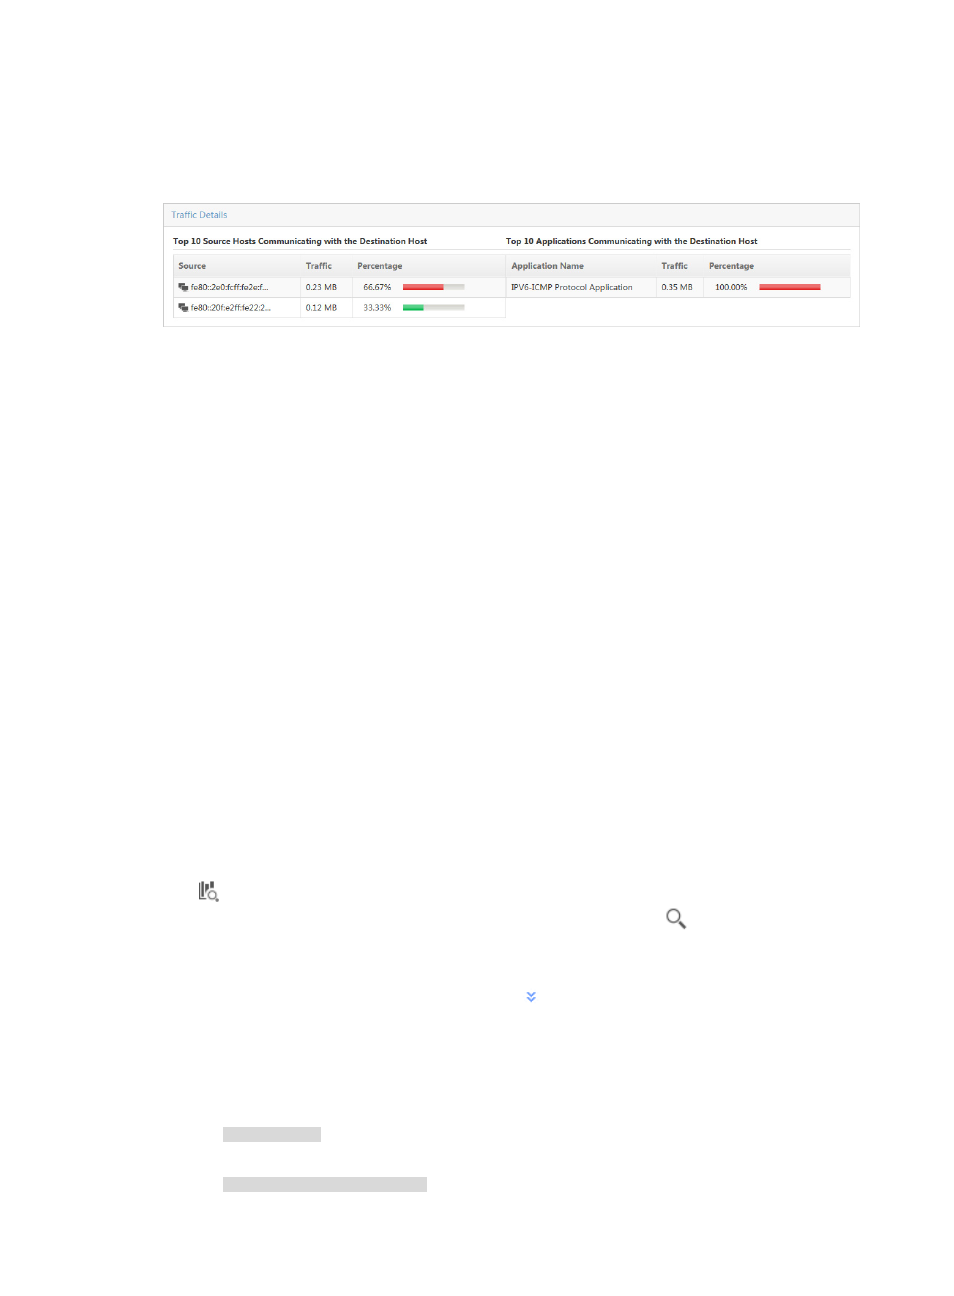
The TopN Applications Communicating with the Destination Host displays the TopN applications,
the volume of traffic attributed to the associated application for the selected destination host, and
the percentage of the associated application traffic observed for this destination host.
Figure 85 Destination Report: Traffic Details For Destination Host
Session reports
A session is a unique source and destination host pair. Session reports provide rate and percentage
distribution of traffic for source and destination pairs for all VLANs configured in a VLAN traffic analysis
task or for an individual VLAN in a task. Click the Session tab to view traffic reports.
Session reports contain the follow fields:
•
Query Sessions—Set the time range for the session host reports.
•
TopN Traffic Report for Session Host—Displays the distribution of the traffic that generated by the
TopN session hosts for all VLANs in the selected traffic analysis task or for a VLAN in a task.
•
TopN Traffic List for Session Host—Provides a list of the TopN session hosts measured by volume of
traffic on all VLANs in the selected traffic analysis task or for a VLAN in a task.
•
Session Host Traffic Trend Report—Provides the average rate of traffic for the source and
destination host pair.
•
TopN Applications for Session Host—Displays the TopN applications observed for the selected
session pair, the volume of traffic sent and received between this session pair, and the percentage
of all traffic observed for the session pair.
The introduction to session host reports also applies to individual VLANs in VLAN traffic analysis tasks.
Query sessions
NTA enables you to change the filter criteria for session reports. You can change the default settings for
source or destination session pair information, or time range to customize the charts and lists displayed.
1.
In the query criteria area in the upper right corner of the session report, click the query criteria icon
. On the list that appears, select Last 1 hour, Last 3 hours, Last 12 hours, Last 24 hours, Last 7
days, Last 30 days, Last 3 months, or Custom. Click the Query icon
in the query criteria area
to set the time range for the session report.
2.
To customize the time range for the session report, select Custom from the list that appears in the
query criteria area, or click the Advanced icon
to the right of the query criteria field to expand
the query criteria setting area.
3.
Enter or select one or more of the following query criteria:
•
Source Host—Enter the IP address or address range in the Source Host field.
An example of a valid IP address entry is as follows:
10.153.89.10
An example of a valid network or subnet mask in dotted decimal notation is as follows:
10.153.89.0/255.255.255.0