H3C Technologies H3C Intelligent Management Center User Manual
Page 147
137
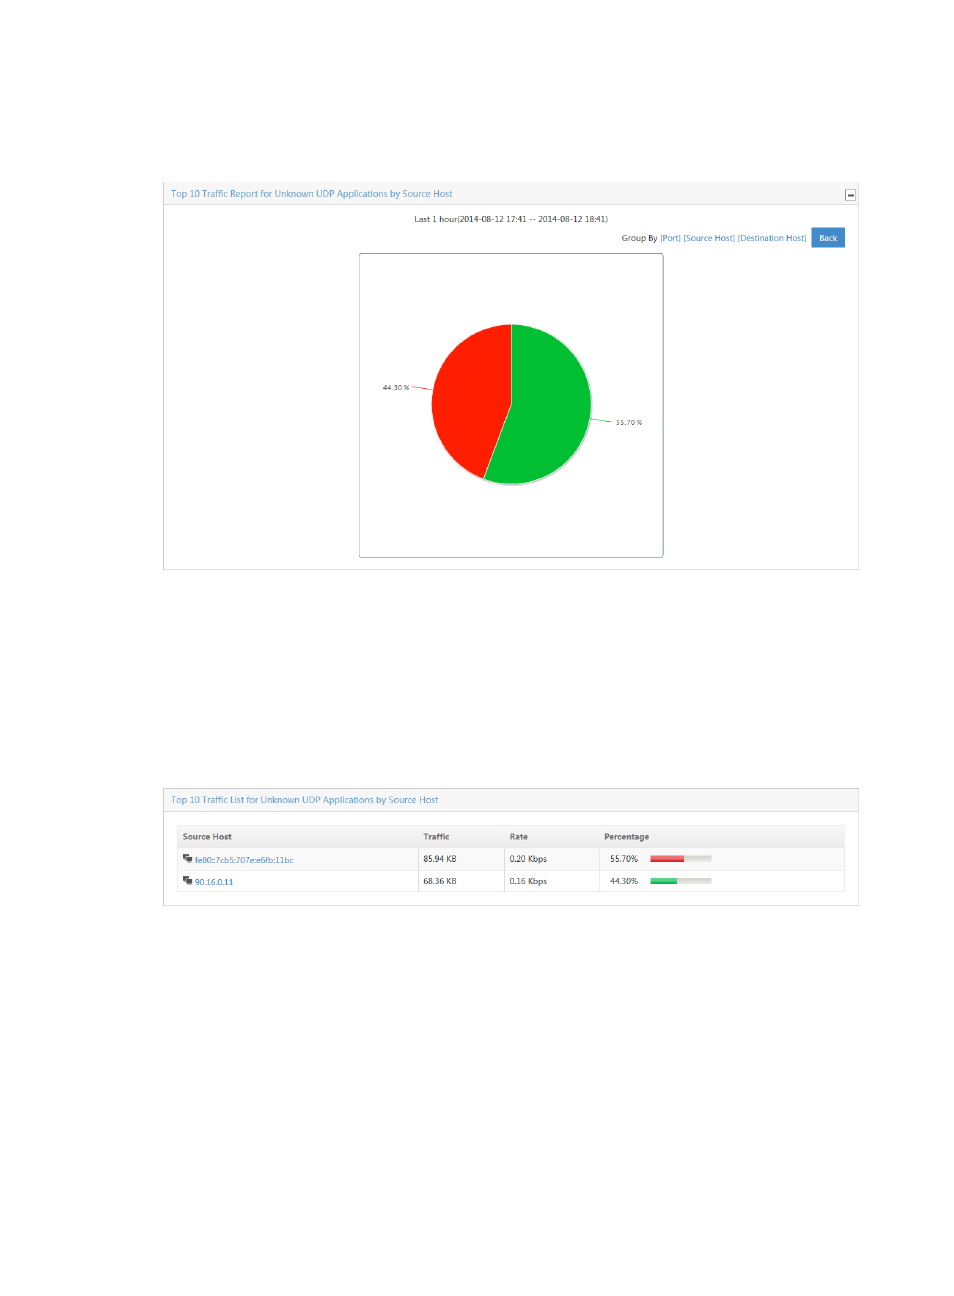
By default, the pie chart is grouped by port. Click the Source Host link to group the pie chart by source
host. Click Back to return to the main Application report page.
Figure 62 Application Report: TopN traffic report for unknown TCP/UDP application by source
TopN traffic list for unknown TCP/UDP application by source
The TopN Traffic List for Unknown TCP/UDP Application by Source provides a list of the TopN source
hosts using unknown TCP/UDP applications on all VLANs in the selected traffic analysis task for the
selected time range. This list includes the source host, total volume of traffic for the associated source host,
rate of traffic, and the percentage of all observed traffic generated for the unknown application. The
source host is a link to individual reports for the selected source host.
Figure 63 Application Report: TopN traffic list for unknown TCP/UDP application by source
Traffic trend report for unknown TCP/UDP applications by source
The Traffic trend report for unknown TCP/UDP applications by Source line chart provides the average
rate for an individual source host using unknown TCP/UDP applications for all VLANs in the selected
traffic analysis task or a VLAN in a task. If there is more than one VLAN for the selected task, this chart
reflects traffic for all VLANs configured in a task. Click Back to return to the Unknown Application Traffic
Information page.