Individual application category reports, Application category traffic trend, Topn application category usage list – H3C Technologies H3C Intelligent Management Center User Manual
Page 115
105
Figure 31 Application Report: Application Category Traffic Trend - In/Out
Individual application category reports
NTA provides traffic trend statistics for the individual protocol categories observed on the interfaces for
a selected task. Individual protocol category reports have the Application Category Traffic Trend report
that displays the average rate of traffic for the selected application category. Individual application
category reports also have the TopN Application Category Usage List that identifies the TopN source and
destination hosts.
To view application category reports for an interface task or for a single interface in an interface task,
click the name in the Application Category field of the Application Category List report for the
application category for which you want to view this report. For more information about Application
Category List, see "
Application category traffic trend
The Application Category Traffic Trend – In/Out graph provides the average rate for an individual
application category for all interfaces in the selected traffic analysis task or for an individual interface in
a task. If there is more than one interface for the selected task, this chart reflects traffic for all interfaces
configured in a task. By default, this graph displays statistics for the previous hour.
1.
In the upper right corner of the chart, click the Previous button to view data for an earlier period.
2.
In the upper right corner of the chart, click the Next button to view data for a later period.
Click Back to return to the main Application Category report page.
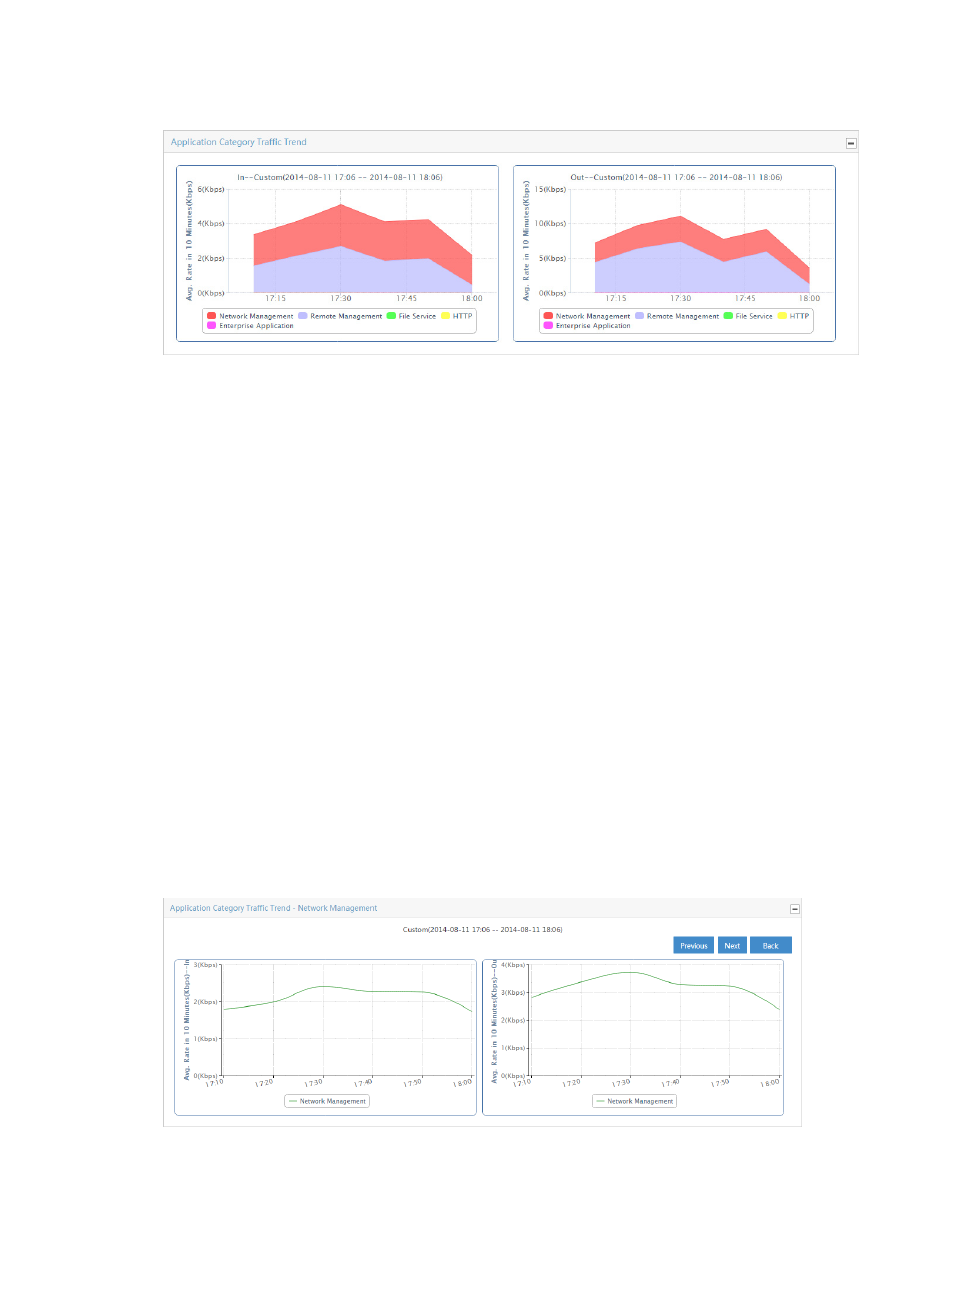
Figure 32 Application Report: Application Category Traffic Trend Report for an Individual Application
Category – In/Out
TopN application category usage list