Destination reports, Query destinations – H3C Technologies H3C Intelligent Management Center User Manual
Page 120
110
To view this report for an interface task or for an interface in a task, click the slice of the pie chart on the
TopN Traffic Report for Source Host report for the source host you want to view statistics for. Or, click the
IP address for the source host you want to view statistics for from the TopN Traffic List for Source Host list.
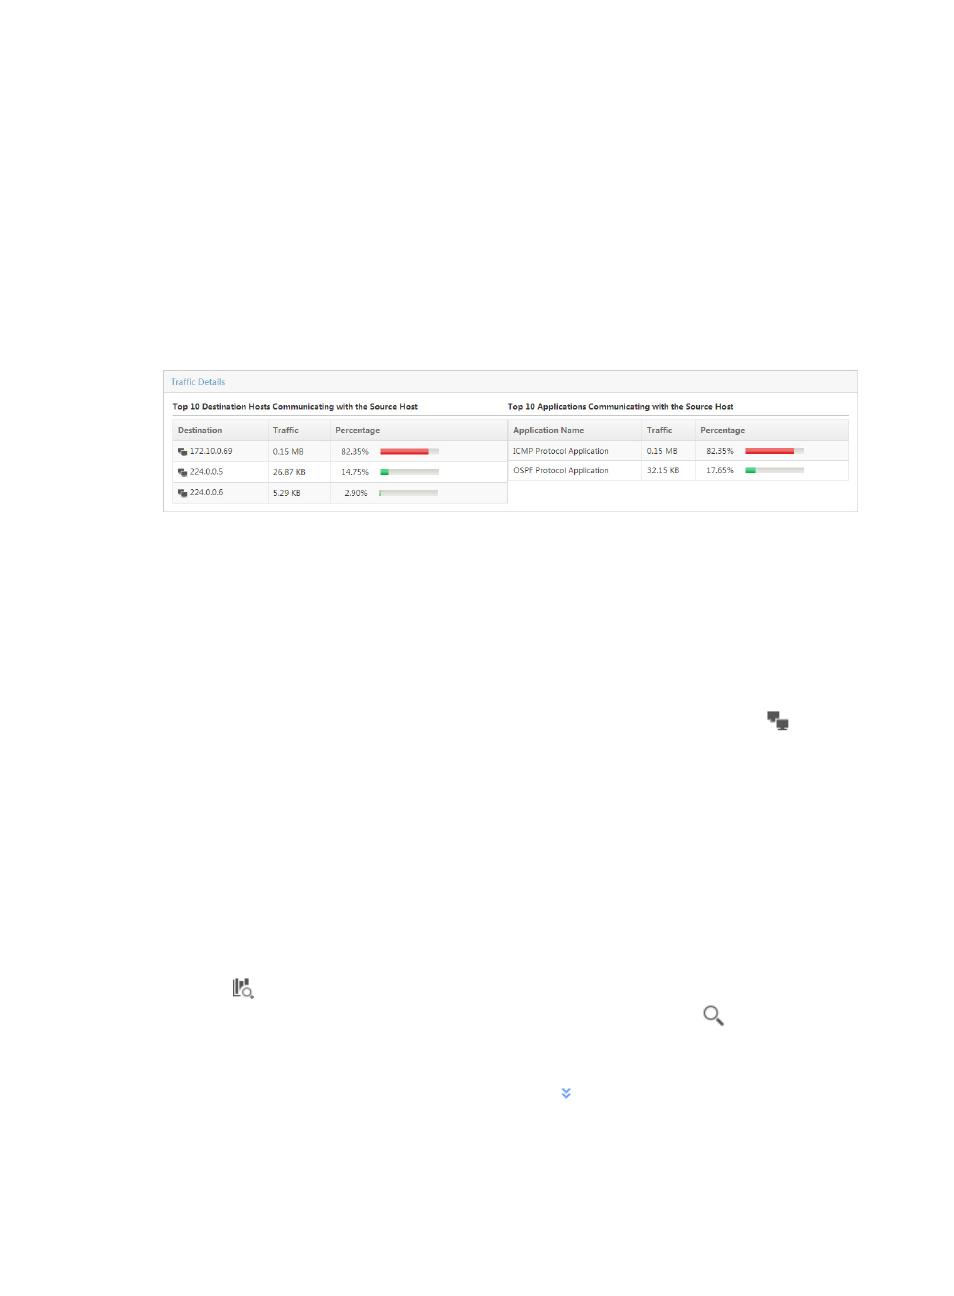
The Traffic Details for a source host table provides two lists. The TopN Destination Hosts Communicating
with the Source Host displays the TopN destination host IP addresses, the volume of traffic sent and
received between this source and destination hosts, and the percentage of all traffic observed for this
source and destination hosts.
The TopN Applications Communicating with the Source Host displays the TopN applications, the volume
of traffic attributed to the associated application for the selected source host, and the percentage of the
associated application traffic observed for this source host.
Figure 37 Source Report: Traffic Details
Destination reports
Destination reports include inbound and outbound reports. Both reports have a TopN Traffic Report for
Destination Host pie chart. The pie chart displays the distribution of traffic that generated by the TopN
destination hosts for all interfaces in the selected traffic analysis task or for an interface in a task. Both
reports also have the TopN Traffic List for Destination Host, which provides a list of the TopN destination
hosts measured by volume of traffic observed on all interfaces in the selected traffic analysis task or for
an interface in a task. The pie chart contains a link to traffic reports for the selected host.
The list also contains a link to reports for the selected destination host. The host query icon
next to the
Destination IP address is a link for initiating a host query and a link to the results of the host query. As with
all of the report types for an interface task, NTA also provides a query option for filtering reports based
on criteria you define.
To view the reports for an interface task, click the Destination tab to view traffic reports for the selected
interface traffic analysis task.
Query destinations
NTA enables you to change the filter criteria for destination reports. You can change the default settings
for destination host, or time range to customize the charts and lists displayed under the Destination tab.
1.
In the query criteria area in the upper right corner of the destination report, click the query criteria
icon
. On the list that appears, select Last 1 hour, Last 3 hours, Last 12 hours, Last 24 hours,
Last 7 days, Last 30 days, Last 3 months, or Custom. Click the Query icon
in the query criteria
area to set the time range for the destination report.
2.
To customize the time range for the destination report, select Custom form the list that appears in
the query criteria area, or click the Advanced icon
to the right of the query criteria field to
expand the query criteria setting area.
3.
Enter or select one or more of the following query criteria: