Traffic details, Source reports – H3C Technologies H3C Intelligent Management Center User Manual
Page 220
210
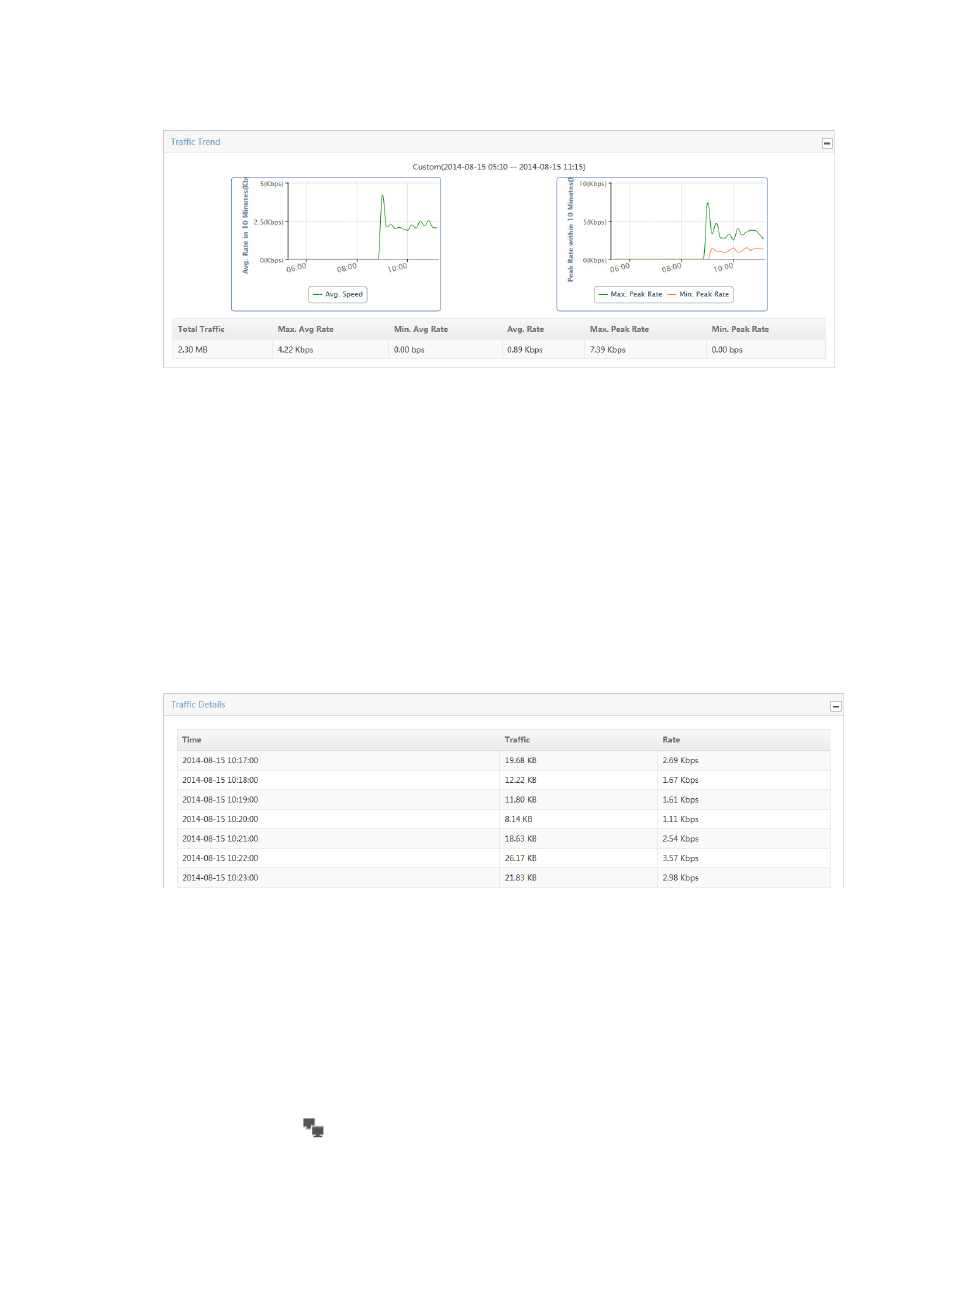
Figure 128 Traffic Report: Traffic Trend — Peak Rate Report
1.
In the upper right corner of the Traffic Trend chart, click the Previous button to view data for an
earlier period.
2.
In the upper right corner of the Traffic Trend chart, click the Next button to view data for a later
period.
For more information on enabling Peak Traffic Analysis, see "
Configuring NTA traffic analysis
."
Traffic details
The Traffic Details list provides the data collection samples for traffic statistics for all applications in the
task based on the report time range. This report includes timestamp, total volume of traffic and traffic rate
in seconds for both inbound and outbound traffic for the selected time range.
Figure 129 Traffic Report: Traffic Details
Source reports
Source reports include the TopN Traffic Report for Source Host pie chart, which displays the distribution
of traffic for the TopN source hosts for all applications in the selected traffic analysis task for the selected
time range. This report also contains a link to traffic reports for the selected host.
Source reports also include the TopN Traffic List for Source Host, which provides a list of the TopN source
hosts measured by volume of traffic observed on all applications in the selected application traffic
analysis task for the selected time range. This report also contains a link to reports for the selected source
host.
The host query icon
next to the Source IP address is a link for initiating a host query and the results
of the host query. As with all of the report types for an application task, NTA also provides a query option
for filtering reports based on criteria you define.