Protocol traffic trend, Protocol traffic trend for an individual protocol – H3C Technologies H3C Intelligent Management Center User Manual
Page 152
142
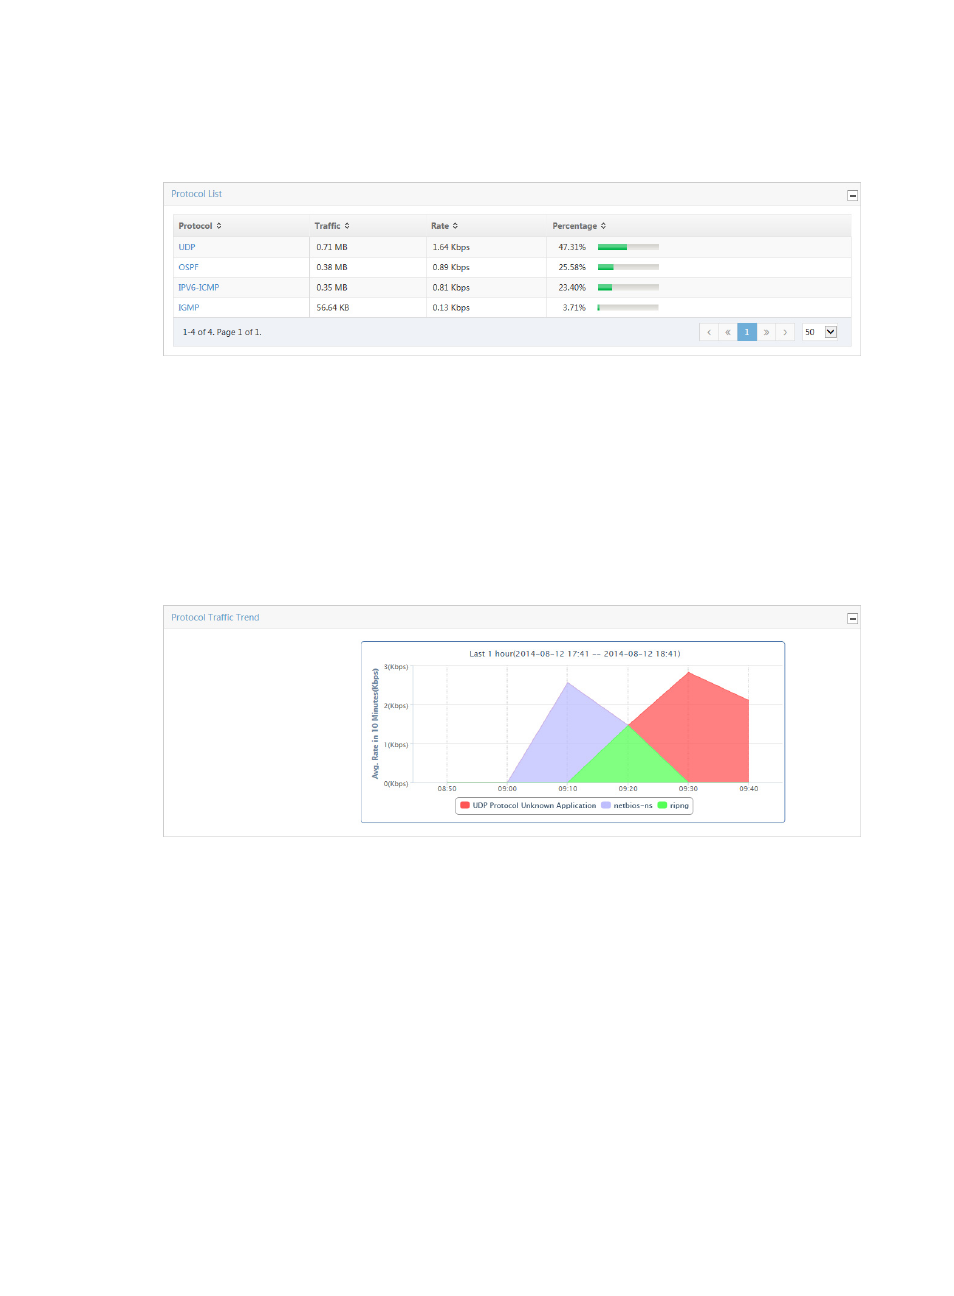
the associated protocol, rate of traffic and the percentage of traffic on all VLANs generated by the
associated protocol. The protocol name in the Protocol field is a link to reports for the selected protocol.
Figure 70 Protocol Report: Protocol List
Select 8, 15, 50, 100, or 200 from the lower right side of the main pane to configure how many items per
page you want to view.
Protocol traffic trend
The Protocol Traffic Trend stacked area chart provides average inbound or outbound traffic rates for all
protocols observed for all VLANs in the selected traffic analysis task or for a VLAN in a task for the
selected time range. If there is more than one VLAN for the selected task, these statistics reflect traffic for
all VLANs configured in a task.
Figure 71 Protocol Report: Protocol Traffic Trend
Protocol traffic trend for an individual protocol
The Protocol Traffic Trend graph provides average rate of traffic for an individual protocol for all VLANs
in the selected traffic analysis task or for VLAN in a task. If there is more than one VLAN for the selected
task, this chart reflects traffic for all VLANs configured in a task.
By default, the Protocol Traffic Trend graph displays statistics for the previous hour.
•
To view data for an earlier period, click the Previous button in the upper right corner of the chart.
•
To view data for a later period, click the Next button in the upper right corner of the chart.
Click Back to return to the main Protocol report page.